Last Friday, Chinese regulators said that they were going to make borrowing on margin more difficult for investors in an effort to curb the recent euphoria in Chinese stocks.
I have to admit that I didn’t grasp just how hot Chinese markets have been recently, partly because the Chinese stock markets are broken up into multiple segments that are hard to follow and have dramatically different returns.
The Hang Seng index is the oldest Chinese market index dating back to 1964 and the stocks when the British ruled Hong Kong as a colony. The Hang Seng index includes Hong Kong based stocks and are referred to as ‘H-shares.’
They are denominated in Hong Kong dollars (which are, in turn, pegged to US dollars) and mainland Chinese investors were first allowed to purchase H-shares in 2007.
While mainland Chinese investors were prohibited from buy H-shares, they were able to purchase ‘A’ and ‘B’ shares that foreigners cannot buy (with some exceptions)
Both A- and B-shares are listed on either the Shanghai or Shenzhen exchange and trade in different currencies. The A-shares are only traded in the Chinese currency, the renminbi, while the B-shares trade in Hong Kong dollars or US dollars.
More recently, a new class of shares has been created, N-shares, which are incorporated outside of mainland China and are listed in the United States.
If that isn’t enough, so called ‘Red Chip’ stocks are state-owned Chinese companies that are incorporated outside mainland China, mostly in Hong Kong and ‘P-Chip’ stocks that are incorporated in jurisdictions like the Cayman Islands or Bermuda that are traded in Hong Kong.
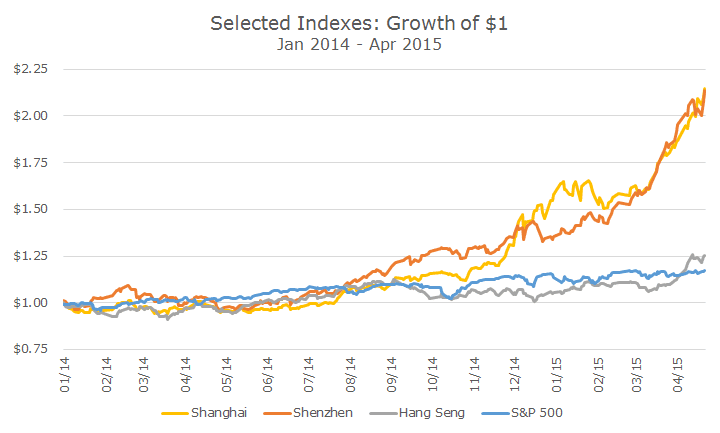
While the Hang Seng index is up about 25 percent since the beginning of 2014 (in US dollar terms), the Shanghai and Shenzhen composite indexes are up about 110 percent in US dollar terms and ~115 percent in renminbi terms. In the chart above, you can see that the real difference in performance didn’t start until the fall of last year.
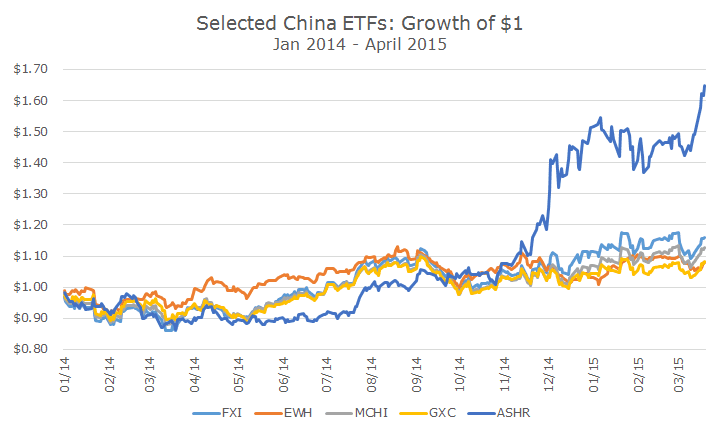
There are more than a dozen US-based exchange traded funds (ETFs) that all track different segments of the market and the performance varies quite a bit.
The top five China based ETFs hold about 95 percent of all of the assets dedicated to sector, based on data from ETFdb.com, an online ETF database.
As you can see from the chart below, only one of the ETFs has direct exposure to A-shares from the mainland exchanges. The others are variations of the H-share stocks traded in Hong Kong.
Given the substantial run-up in the mainland exchanges, a lot of investors are saying that it’s a bubble. I’m not really close enough to Chinese markets to say one way or another, but the valuations are relatively high.
For example the price-earnings (PE) ratio for the S&P 500 is 18.55, which I think is on the expensive side. The PE ratio for all publicly traded stocks globally is 18.49, based on the MSCI World index. Stocks on the Hang Seng Index have a PE ratio of 11.71, which the Shanghai and Shenzhen composites trade at PE ratios of 21.66 and 53.02 respectively.
Given that the really high valuations are on the mainland China indexes, particularly the Shenzhen composite, it would appear that the direct market impact of the bubble bursting would be small, mostly affecting Chinese nationals.
Of course, there would likely be some spillover since these are not small exchanges. The stocks in the Shanghai stock exchange have a market value of about $3.99 trillion, the Shenzhen is about $2.23 trillion and the Hang Seng is about $3.33 trillion.
By comparison, the NYSE and NASDAQ are about $16.22 and $6.83 trillion in market value respectively.
Indeed, it’s difficult to say what the bubble in mainland Chinese stocks means for US investors.
Winston Churchill said that ‘Russia is a riddle wrapped in a mystery inside an enigma.’ If he were alive today, I think he would say the same thing about Chinese stocks and markets at this point.