In September, I wrote an article about the Dow Jones Industrial Average (DJIA) – how it was constructed, how it compares to the S&P 500 and why I think, to quote myself, ‘that it’s an almost worthless relic of history.’
A few readers emailed me to say that while they agreed that the DJIA is a funny index with its price-weighted construction and limited number of stocks, its performance roughly matches that of the venerable S&P 500.
When I first loaded the two indexes up on my Bloomberg terminal, I found that S&P 500 walloped the DJIA by several percentage points per year for decades.
I was feeling pretty smug until I realized that the index on Bloomberg was including dividends for the S&P 500 but not for the DJIA. For reasons that I don’t know, the total return index for the DJIA index only dates back to 1988, which is pretty recent in my book (I remember it for one thing).
When you make the apples-to-apples comparison, guess what? The DJIA beats the S&P 500 by 0.76 percent per year. That may not sound like much, but when you compound that over 27 years, it ends up being a lot of money.
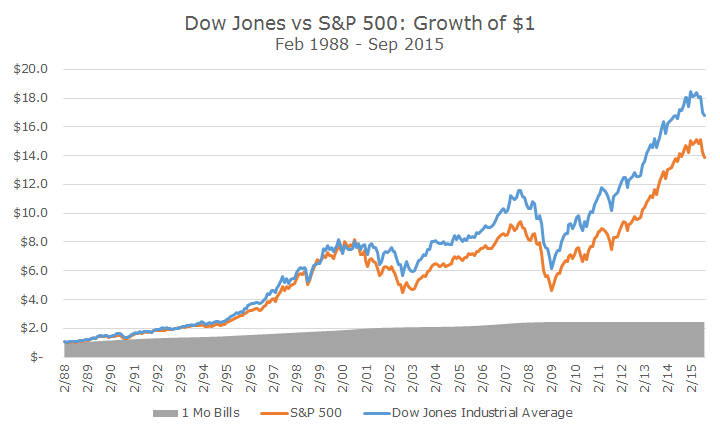
A single dollar invested in the S&P 500 would have turned into $13.87, but would have been $16.78 in the DJIA – an additional 20 percent of additional wealth.
What’s worse for a DJIA-hater like me is that the DJIA was also less volatile than the S&P 500, which means that it’s even better on a risk-adjusted basis.
There is an exchange-traded fund (ETF) that tracks the DJIA that’s been around since 2000 and since then, it’s beaten one of the S&P 500 ETFs by 1.10 percent per year since then (through Sep 30).
Interestingly, the ETF that tracks the DJIA has $11.6 billion in assets under management while the three largest ETFs tracking the S&P 500 have 283.7 billion in assets under management. I guess I’m not the only one with the S&P 500 bias.
As always, this begs the question: should we change up our strategy to become more like the DJIA and less like the S&P 500? It’s a good question in the face of this data, but I don’t think so.
While the past performance is better, that’s not the only criteria that we evaluate. We much prefer the diversification that you get from having 500 securities instead of 30.
I’m always a little bothered by the fact that the top 10 holdings of the S&P 500 represent 17.6 percent of the assets, but that’s nothing compared to the DJIA, where 51.2 percent of the assets are in just 10 stocks. We’ll take the diversified bet over the concentration any day.
Second, the out-performance isn’t quite as good as it looks and is probably just chance. I ran a series of statistical tests to determine how much confidence we can have that the DJIA actually outperformed the S&P 500 or whether it was just luck (or not enough data). It turns out that the confidence level of that outperformance is only 11 percent – not even a coin toss.
When your confidence is low, it doesn’t make sense to bet big, which is what the concentration in the DJIA would force you to do, so we won’t be changing course.
Still, though, I won’t be bashing the DJIA in the future like I have in the past. I still think it’s a goofy index, but I’ve been humbled by the data.