Last week, I wrote that REITs and TIPs are relatively pedestrian ‘alternatives’ because they are so commonly used.
TIPS, which stands for Treasury Inflation Protected Security, are issued by the government – how could they be alternative? What could be more mainstream than a bond issued by the government?
Back in August, I did a write up on REITs and they really are different from traditional stocks and bonds, and TIPs are like REITs in that regard.
TIPs were first issued by the Treasury in 1997 and are designed to explicitly protect investors from inflation by unambiguously tying the value of the principal to inflation via the Consumer Price Index (CPI).
Let’s look at an example, with a number of simplifying assumptions of course.
A regular (or nominal) bond would have face value of $1,000 and have a five percent coupon rate. At the end of year one, you get a $50 coupon payment. At the end of year two, you get another $50 coupon payment plus your $1,000 back.
With a TIP, we can assume some of the basics are the same: a face value of $1,000 and a five percent coupon rate. At the end of the first year, though, inflation (CPI) rose two percent, so the value of the principal is adjusted upwards by two percent to $1,020.
Because the principal is now higher, the five percent coupon is higher: $1,020 * 5% = $51. At the end of year two, inflation is up another three percent, so the principal is adjusted to $1,050.60 and the second year coupon payment is $52.5.
That’s a very unique and important feature that is particularly important to retirees who are especially vulnerable to inflation pressures. One well known economist and textbook author, Zvi Bodie, said in 2009 that people should put 100 percent of their retirement savings in TIPs. Wow!
Of course, we don’t go that far. In fact, our TIPs allocation is only 10 percent of our bond allocation, which means that a 50/50 stock/bond portfolio would only have a five percent allocation to TIPs. That’s a long way from a 100 percent allocation – why not do more?
First and foremost, regular bonds have inflation expectations built into the price already. Sometimes, those expectations are high, low or right on the money, but it’s not as if regular bonds completely ignore inflation risks.
In fact, it’s well documented that regular bonds should earn a little more than TIPs, all else equal, because there has to be some additional compensation for the uncertainty associated with being wrong on the difference between expected and realized inflation.
There are periods where TIPs won’t perform well versus regular bonds, like when real (or inflation adjusted) rates rise and inflation is lower than expected.
As a matter of fact, that’s exactly what’s happened in the past few years and TIPs have underperformed during that time. For the last three years, ending yesterday, the Barclays US TIPs index has gained 1.17 percent versus 2.73 percent for the Barclays Aggregate Bond index.
We first started adding TIPs in 2009 and the performance has neatly matched the overall bond market since then.
At this point, despite the recent underperformance, we plan to keep TIPs in the portfolio for two reasons. First, TIPs are lowly correlated to stocks and other kinds of bonds, making them a useful diversification tool.
Second, TIPs are a great hedge against unexpected inflation. If markets assume inflation will be three percent and it turns out to be five percent, your TIPs will have kept up while your regular bonds will have lost purchasing power.
One of the interesting features about TIPs is that when you compare their yields against regular bonds, you can see what markets expect regarding inflation.
Right now, the yield on the nominal 10-year US Treasury is 2.34 percent (astonishingly). The yield on the 10-year US TIP is 0.42 percent. Therefore, the bond market expects inflation over the next decade to be 1.92 percent – the difference in the two yields.
The yields on the two securities change continuously to reflect ever-changing views on inflation. The chart below shows the breakeven rate for 10-year bonds in recent years.
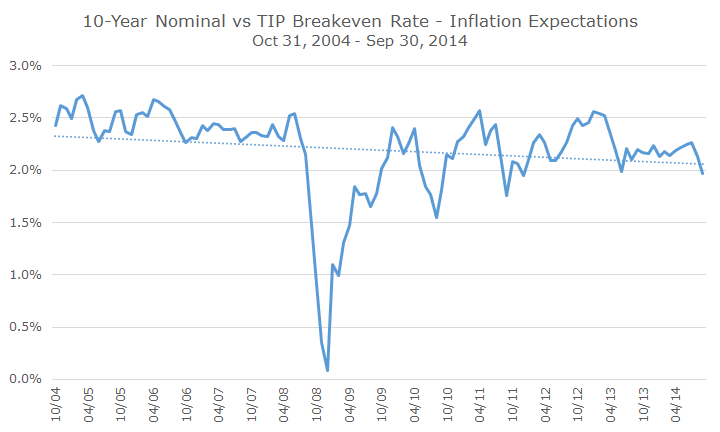
It’s an interesting chart, in part because you can see that inflation expectations have really fallen over the last decade.
During the crisis, you can also see when markets expected deflation, when overall prices decline. That sounds great because everything goes on sale, but it’s a real problem because consumers wait for goods and services to get even cheaper which causes growth to stall.
When markets were pricing in deflation, there was a lot of hysteria about hyper-inflation. I remember hearing people compare our situation to Zimbabwe’s because the Federal Reserve was printing money in the form of quantitative easing. That program will be wound down next year and inflation does not appear to be on the horizon.
Of course, that can change suddenly, you never know, so for the moment, we will keep TIPs in the portfolio as an insurance policy against unexpected inflation.