The same fine reader that asked about buy-side versus sell-side research asked another useful question about market valuation metrics. Let this be a signal to all readers that I demonstrate my appreciation for questions with answers!
The question refers to an article by Mark Hulbert from CBS Market Watch that looks at six different valuation measures that all come to the same conclusion – that the market is overvalued.
First let me say that although I don’t always read Hulbert, I admire his work. He is the only person that I am aware of that attempts to seriously track the performance of newsletter writer recommendations.
These newsletters are rife with big promises of huge returns or doom and gloom that suggest that the market is always on the precipice of a major collapse. Of course both are exaggerations, but since the re-subscription rate on newsletters is less than 10 percent, they always have to go big on greed or fear to get new subscribers.
Hulbert’s research in general has shown just how terrible the results are for these newsletters prognostications.
In this article, though, Hulbert looked at the price-earnings ratio, the cyclically adjusted price-earnings ratio (or Shiller PE), the dividend yield, the price-to-sales ratio, the price-to-book ratio and the Q Ratio (or Tobin’s Q).
He does a nice job of summarizing each one and I don’t have much to add to his descriptions, but I do think it’s useful to say that in all of the cases, you’re looking at the price of the stock versus some metric of fundamental value like sales, earnings, book value, etc., so it shouldn’t be a huge surprise that if one is high then they are all likely to be high.
A different article that I saw in The Economist, showed the following chart comparing the Shiller PE ratio with Tobin’s Q (this sounds exotic, but simply compares the value of the company to the replacement cost of all of their physical assets).
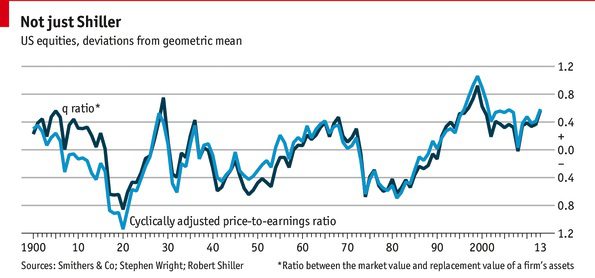
There’s remarkable similarity between the two charts, partly because the numbers were scaled to zero so that you can see the percentage over/undervaluation from the average.
When you look at the chart now, you can see that the market is overvalued on these two metrics (and the other four, just not in this picture) in the sense that the valuations are 40 percent higher than average.
My first thought is, ‘wow,’ that makes me nervous! If you believe in mean reversion, as I do, then you have to consider that the market could drop by 40 percent just to get these valuation metrics back to the average level.
Then you realize that markets could fall much lower than that because they could drop to the point that the market is 40 percent undervalued like it was in the late 1970s. That’s even worse!
I’ve been looking at both of these ratios for years, before the 2008 financial crisis (when the valuations did get back to average) and since. What you notice after a while is that the metrics don’t hover closely around zero – they go well above and below for extended periods (years).
This chart would be better drawn with a band around the average of, say, plus or minus 25 percent, or a single standard deviation, or something to show that you don’t care about just the average; you care about some range around the average.
I promise that I will do that in the near future, but until then, I can tell from eyeballing that we above the top end of the range and possibly outside of it on the high side.
In analysis that we have done a few years ago to confirm what other researchers were finding, is that when valuations are high, like they are now, that market returns are likely to be lower than average in the next five, seven or ten years.
The problem is that these valuation models (somewhat regardless of which one you choose) only explain about 40 percent of the next ten-year returns. That’s not a strong enough signal for us to want to trade on. It’s good for setting realistic expectations, but not to enter or exit the market.
If you wanted to tilt your portfolio from a 60/40 stock bond to a 55/45, I would be OK with that, but that leads to another problem – the current yield is the best estimate for future returns on bonds and I said at the top that the yield on the 10-year Treasury is less than three percent.
Hulbert ultimately concludes by saying that ‘timing the market is notoriously difficult, so you might choose to stick with your stock positions throughthick and thin.’
That’s pretty much our approach, the key is making sure that you’ve got the financial and emotional wherewithal to stick to your plan when the bad times come, whether that’s next week or in five years. If you’re unsure, now is the time to work with us to figure out the right path forward.