When people ask me how long their time horizon ought to be when investing in stocks, I usually say 10 years. It occurred to me the other day that either I’ve never really looked into this in a very detailed way or I’ve forgotten about it. In either case, it’s now time to look.
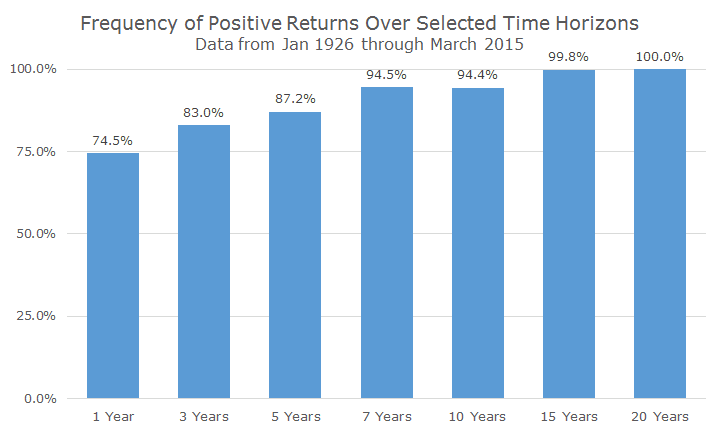
To answer this question, I looked at rolling returns for the S&P 500 since 1926 for a variety of time horizons, starting with a one-year rolling period. There are 790 rolling one-year periods since 1926 (January to January, February to February, March to March, etc.) and 74.5 percent of them have positive returns.
That’s pretty good actually – in any given one year period, stocks have risen three out of four times. This is the frequency argument, which only tells half of the story. The other half is the question about magnitude: how much did you lose one quarter of the time? On average, during the 12-month periods where returns were negative, the annual loss was -14.4 percent.
What people really care about, though, is not how much is lost ‘on average’ (remember the economist whose head is in the freezer and feet are in the oven that feels fine on average), but how much could they lose during the bad times. Since 1926, the worst one-year holding period for stocks was -67.6 percent back in the 12 months that ended in June 1932. That’s horrendous!
There are basically two universally accepted ways to deal with losses like this. First, don’t invest in stocks. Or, at least, don’t invest your whole portfolio in stocks. We are definitely advocates of this approach and most of our clients have a healthy allocation in bonds even while interest rates are agonizingly low. This is diversification 101.
The second approach is sometimes called time diversification. Personally, I think that name is silly because all it really means is that you have to wait it out. Whatever you call it, we’re advocates of this approach too and the frequency and magnitude data for the other time horizons give a sense of just how long you have to wait to weather the storms.
The chart below shows the frequency data for the S&P 500 in a variety of rolling time horizons. The good news is that historically, most of the time, stocks had positive returns.
The bad news is that when stocks lose money, they can lose LOTS of money as the following magnitude chart shows.
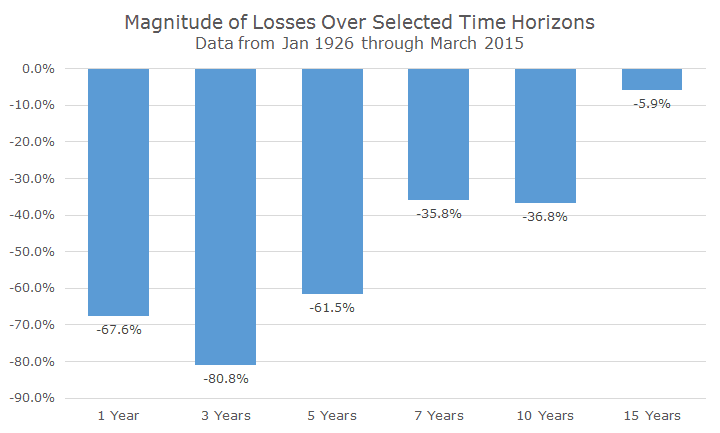
I was surprised by two numbers in the chart. First, I was surprised that the three year numbers were worse than the one year numbers. While I was surprised, it makes perfect sense because the worst bear markets are really protracted affairs and things often go from bad to worse.
Second, I was surprised that there were 15-year periods where stocks had losses. I think I knew this in the back of my head too, but I was still surprised that you could go 15 years in stocks and still have less than what you started with.
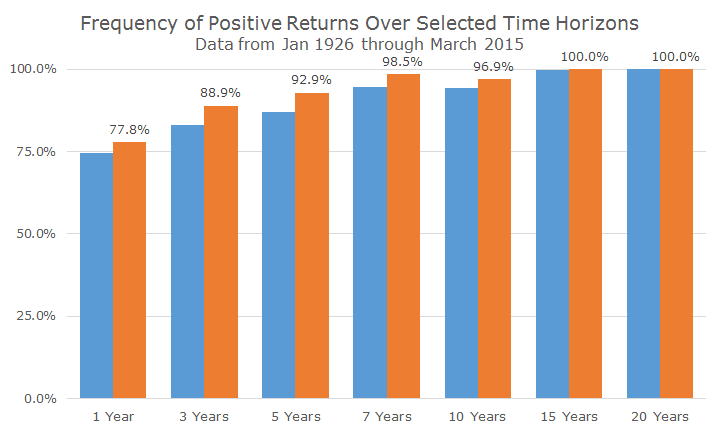
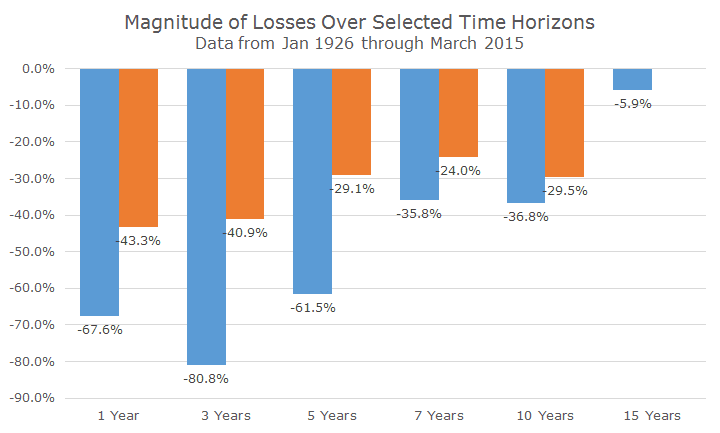
To some degree, this is due to the Great Depression, when stock returns were truly awful. I wanted to see what the data looked like without the Great Depression and did the same analysis for 75 years, which takes us back to 1940.
I’m not saying that what happened in the Great Depression can’t or won’t happen again – it can! In fact, while I don’t want to sound like a Cassandra, things can be worse in the future than they were in the past. In any case, here’s the data:
Unfortunately, there is no magic one-size-fits-all number for what your time horizon ought to be for owning stocks. Suffice it to say, though, it’s a long time. I think my stock answer of 10-years is still pretty good, but as we can see from the data, you can still lose a lot of money in a 10-year period with stocks.
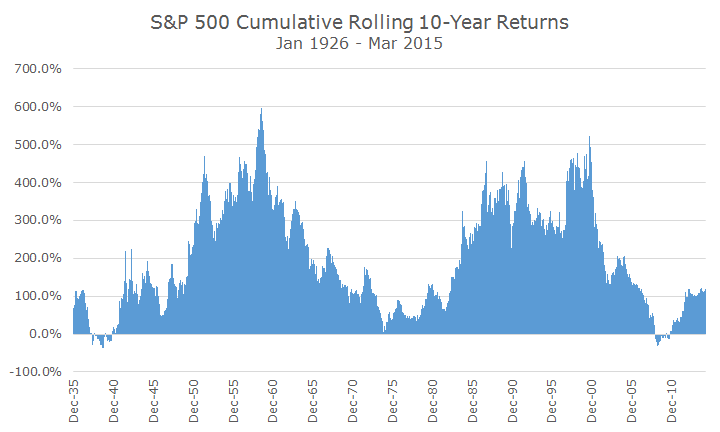
I don’t want to sound like a downer, so let me end on two more positive notes. First, while you can still lose a lot over a 10-year period, you can make a lot too. The following chart shows the rolling 10-year cumulative returns for stocks since 1926. You can see the losing years are definitely there, but there are a lot of winning years and some of them are pretty big.
Secondly, we just made it through some of the worst returns in American history. I’m not saying that it can’t happen again soon (it can), but I’m saying that you’ve got experience getting through the crisis.
Hopefully that means that you’re not taking any more risk than you need to in order to meet your goals and have a nice, well diversified portfolio of stocks and bonds.