I was reading in the Wall Street Journal that homes with 15 or more bedrooms were becoming very fashionable and, in a different article, master suites are now so large that they feature media rooms, offices, gyms, kitchenettes and laundry rooms.
In other words, housing is back!
Okay, maybe those things and the race to build a $100 million spec home (yet another article) signal that the rich are doing fine, and I wondered how the hoi polloi were doing.
During the crisis, we all became housing experts, but to be honest, I hadn’t looked at the data in a while and was interested to see where things stood.
First up, existing home sales. You can see from the chart below that both existing and new home sales are not close to their 2005-2006 peak. I meant to label this a little better – the blue new home sales are on the left axis and the orange existing home sales are on the right.
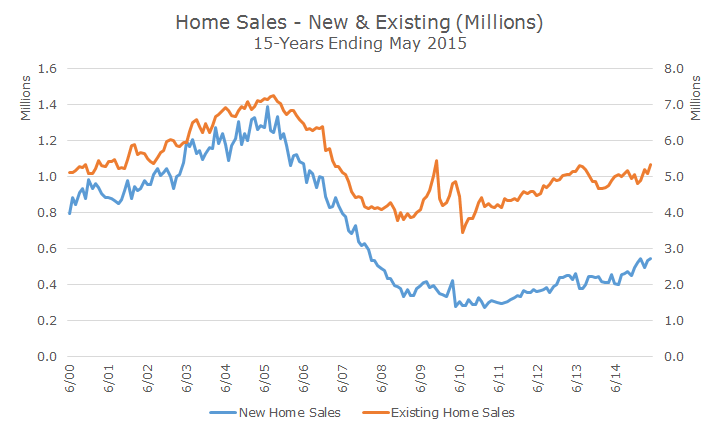
The good news is that the sales bottomed out a few years ago and are clawing their way back, albeit slowly. In May, new home sales grew 2.2 percent to 546,000, following an 8.1 percent increase in April. Single family homes rose 5.6 percent to 4.73 million.
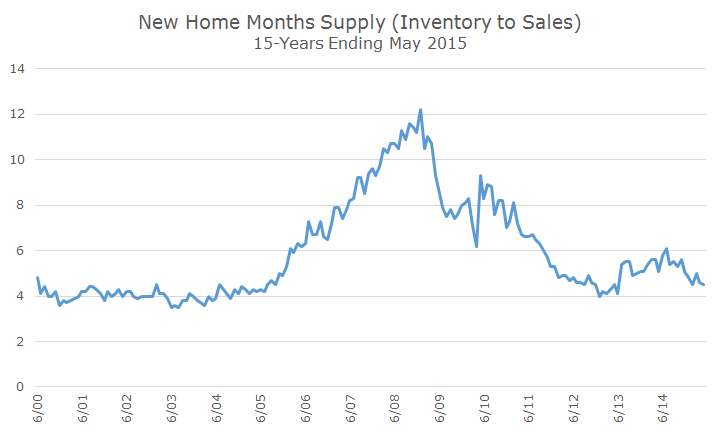
While home sales are not back to their peak levels, inventories for new homes are now fairly lean. Last month, 205,000 new homes were for sale up from a record low of 64,000 in July 2012 but are still below the historical average of 315,000.
When you look at the ratio of inventory to sales, as seen in the chart below, you can see that there are roughly 4.5 months of supply on the market today, which is below the historical average of 6.1 months and well below the crisis high of just of a year of supply.
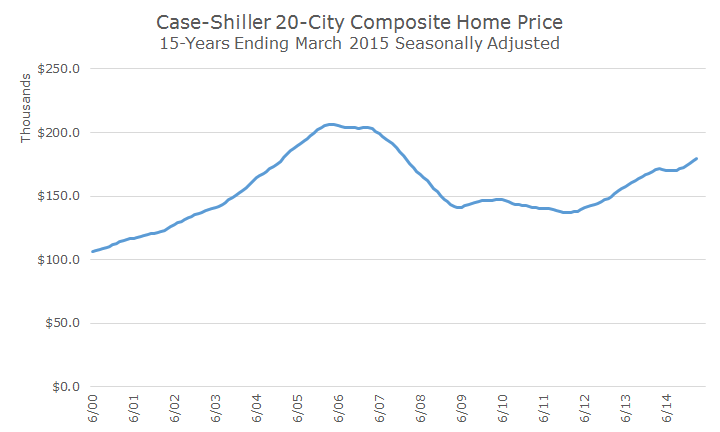
Home prices have also turned up nicely in the last year according to the Case-Shiller 20-City home price composite. This data only comes out quarterly so the chart only goes through March, but you can see that prices have risen on average, although they are still below their peak levels during the bubble.
Of course, some markets are hotter than others, most notably San Francisco and Denver, gaining just over 10 percent in the last year. In some cities prices are down, like Cleveland where values are one percent lower today than a year ago. That was before the Cavaliers lost to the Warriors (there you have it, folks, my one sports reference for the year!)
Overall, household formation and residential investment are still struggling to regain momentum in the wake of the crisis.
Lending conditions, while looser than a few years ago when Former Federal Reserve Chair Ben Bernanke could not get a loan, are still tight. Mortgage rates are also higher now with the average rate on a 30-year fixed rate product at 4.16 percent, according to Bankrate.
Like the overall economy, the housing market is recovering, albeit in a slow and choppy fashion.