People often tell me not to worry about the stock market because it ‘always’ comes back.
That’s true for the United States and most other developed markets, but for my whole career, it wasn’t true for the Japanese stock market, until now.
Last week, the Nikkei 225 price-index crossed a level that it hadn’t seen since 1989. That’s a long, long time.
I Googled the most famous person born in 1989, which is when the Nikkei traded at this level. Not to get political, but the answer was Taylor Swift.
The chart below shows the price history, but not dividend history. I could only get that back to 2010, which is decades after the market peak (the recovery would be shorter by years or maybe decades with dividends).
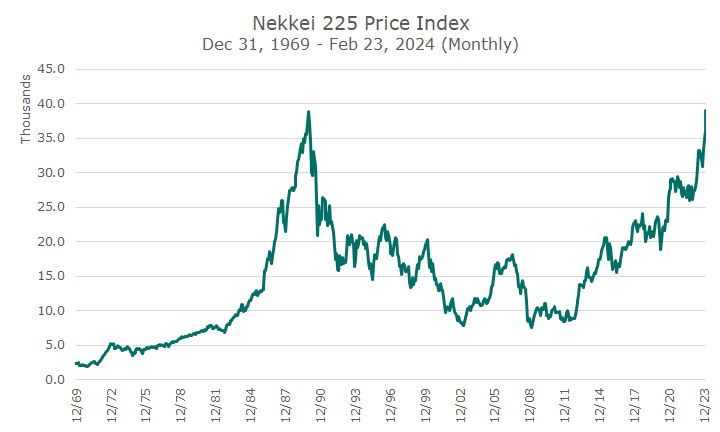
The peak in December of 1989 is the peak of the greatest market bubble of all time. The Japanese economy had boomed for several decades, the real estate market was hot, and so were stocks.
But investors were far too excited about how good their markets would be in the future, and paid prices for stocks that were far too high.
I’ve read that the Shiller Price-Earnings ratio, which measures the market price over ten years of inflation-adjusted earnings, was about 100, which is equal to saying that the real expected earnings yield was one percent.
For reference, the highest the Shiller PE S&P got in the late 1990s tech-bubble was around 40-42. Said another way: in the late 1980s, the Japanese stock market was twice as overvalued as 1990s bubble was.
The chart below tries to give a sense of that, by showing the Shiller PE ratio, as calculated by Bloomberg, back to 2000, when their data starts.
Data on Bloomberg doesn’t go back far enough for me to calculate the Shiller PE ratio myself, so I relied on their data. They do the calculation differently than we do, so I put ‘per Bloomberg’ to suggest that this is their info, not mine.
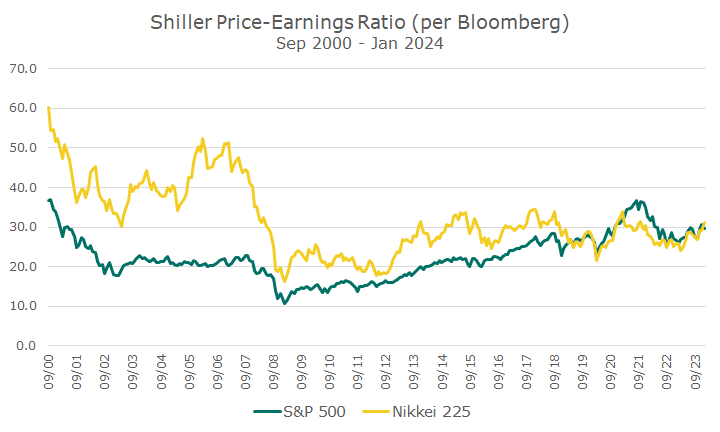
Still, it’s a useful reference. You can see that they have the Shiller PE-ratio for the S&P 500 in the high 30s in late 2000, after the bubble had burst some, so that fits. Interestingly, the Shiller PE-ratio for the Nikkei was still 60 – well over anything reasonable.
Our Shiller PE-ratio was attractive after the 2008 financial crisis (around ten), and while theirs didn’t fall to a level as low as ours, that’s when theirs went from crazy to just high.
After a 15-year bull market for both markets, we’re now at about the same Shiller PE, as calculated by Bloomberg.
That surprised me a little because foreign markets are so cheap relative to the US, but Japan is the biggest weight in developed markets at 20 percent. Could it be the case that everything else is that much cheaper? I don’t know.
To me, it’s a powerful lesson in diversification. If I were a Japanese investor that was wowed by the success of my market in the 1970s and 80s, and failed to diversify beyond that, my retirement would have been pretty lousy.
However, if I had owned a portfolio of global stocks, even one that was overweight Japan relative to the market weight, and had bonds, I suspect the results would be better, although I don’t have the data (and the yields on their bonds have been paltry for a long, long time – maybe as long as Taylor Swifts boyfriend has been alive, I don’t know).
The parable should be obvious: we love the S&P 500 and have a big allocation to it, but we have bonds and other markets as well. I’m not saying we are in a bubble, I don’t think that, but stocks aren’t exactly cheap either.
Expensive or cheap, though, I don’t want to own just one market, it’s just not diversified enough, no matter what the past decades have returned.