Back in February, I wrote that the stock market was overvalued and cited metrics like the Shiller PE ratio and Tobin’s Q that show the market is high relative to history. At the time, I concluded by saying that timing the market is notoriously difficult, so pick your stock/bond allocation and stick with it through thick and thin. (Click here for the article)
A few people called or emailed back saying that they too were nervous about the market, but ultimately everyone held on, which is good since the S&P 500 is up 9.81 percent since then through the close of business yesterday.
About a month ago, I followed up with a similar article and concluded by saying that stock markets overseas were inexpensive on a relative basis and concluded that US stocks still have some nice, positive momentum. (Click here for the article)
I have three follow-up thoughts that I think are worth sharing.
First, I thought of the momentum comment when our own Dan Esser forwarded to me the following chart from Nautilus Capital Management:
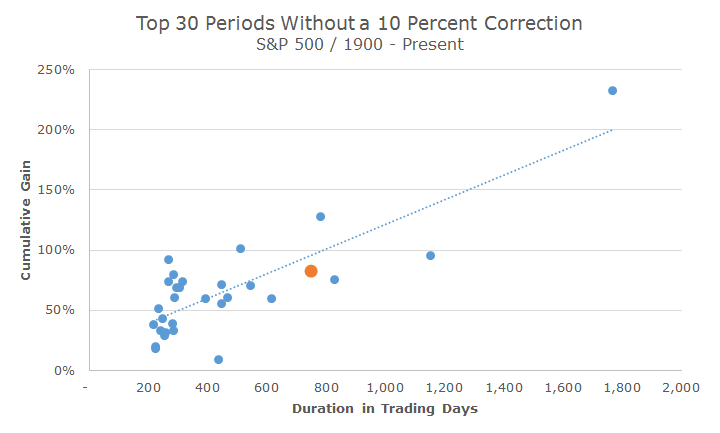
The chart looks at the longest periods of time that the S&P 500 has gone without a 10 percent correct, measured in trading days. The current period, which started in 2011, and is indicated by the enlarged orange dot, is the fifth longest bull market in trading days, as shown on the x-axis.
On the one hand, as a person who believes in mean-reversion, it’s a little disconcerting to think that we’ve gone such a long time without a correction and it’s what makes us think we’re ‘due’ for a correction.
On the other hand, bull markets can go a lot longer – we’re at 474 days and it could go 1,200 or 1,800 days as it has in the past. Momentum can be powerful.
Second, I’ve said that the Shiller PE ratio is one of the best measures out there, but that it’s still not very good. At the DFA conference a few weeks ago, once of the academics went to great lengths to show that you can get statistically significant, but spurious results with enough data.
He gave a lot of examples, but my favorite was trading on sun spots. Obviously, intense magnetic activity on the sun should have nothing to do with stock market activity, but he showed a strategy that provided results from a sunspots signal as the Shiller PE ratio.
He concluded that if you’re willing to trade on the Shiller PE, you should be willing to trade on sunspots. Thankfully, we’ve never traded on the Shiller PE ratio so we don’t have to incorporate sunspots into our strategy.
Finally, even though we may to be getting the overdue correction in large cap stocks, we’re starting to see soft spots in other markets. Small cap stocks, for example, as measured by the Russell 2000, are almost in correction territory. The index peaked in March and is down nearly nine percent since then, through the end of the quarter.
The largest allocation in the stock portion of our portfolio is large cap, by a long shot, but the other asset classes are weighing down the whole portfolio.
That’s okay, though, because there have been other periods where the situation was reversed and the other asset classes were doing well while large was suffering. That’s basically the definition of diversification.
Years ago, someone told me that diversification means that something in your portfolio is always struggling. Someone else told me more recently that if you aren’t feeling pain from something in your portfolio, you’re not diversified enough.
As always, we’re going to stick to one of our cornerstone principles: diversification works. And let me also repeat my conclusion from February: pick an allocation and stick with it through thick and thin.