Well, election day is finally here. Over the past few months, many clients have understandably expressed concern over what may happen to the stock market.
And, while we don’t know what the results will be or when we’ll know them, we do have history to look back on. And, even though I’ve heard both candidates and countless media people say that this is the most important election in our history, all of the other ones were too.
In the most recent edition of Portfolio Insights, we included two articles about how markets respond to elections and their subsequent administrations. The short answer is that elections don’t matter that much, and neither does the party that occupies the White House.
That said, I have some proprietary market history data, thanks to a summer intern from the pre-virus days in the office. We had access to the daily price-only return for the S&P 500 and monthly return data that includes dividends. Through a detailed and boring process, my favorite intern combined the two to create a daily total return index that goes back to the 1920s.
I didn’t have a chance to use the data but realized that it might be interesting to see how markets responded to the actual election day. When we use monthly data, we skim over the fact that elections don’t happen at month-end and can’t see other interesting tidbits like any changes in volatility.
Well, with this new data set, I’ve taken a granular look at all of the elections back to the 1948 contest between Harry Truman and Thomas Dewey. For the analysis, I looked at the 60 trading days before and after the election, which is about three months on either side. I didn’t annualize the returns but did annualize the volatility.
One last word about the analysis before we look at the data: 18 data points isn’t very many!
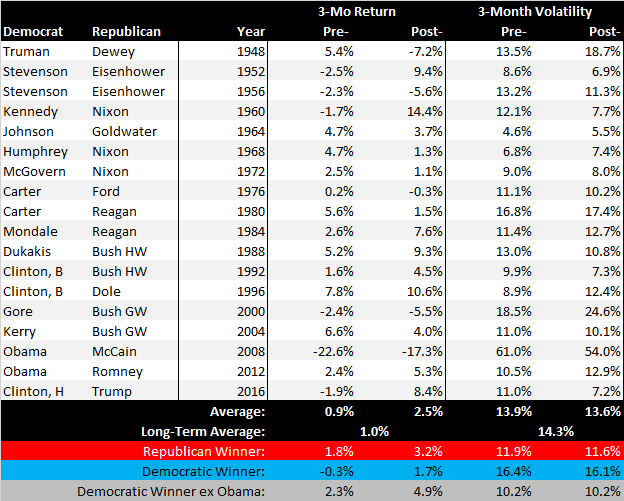
On average and across elections, we see that returns in the three months ahead of elections are a little below the long-term average (and long-term for this analysis starts three months after Truman was elected and ends three months after Trump was elected). The results in the three months following elections are, on average, really strong! Again, the returns are not annualized, but the volatility is.
Even better, volatility is slightly lower after elections, but the three months before and after elections are low on average. It may not feel like that because I think emotional volatility is at the extremes around elections.
I wasn’t planning on looking at the results by party, but then I thought: what the heck – let’s enrage half of our readers!
When a Republican wins, the returns go from good to great, from 1.8 percent to 3.2 percent. When a Democrat wins, the returns go from negative to positive, but the margin of gain is higher (2.0 percent versus 1.8 percent).
Here’s the thing, though: the 2008 financial crisis skews everything. You can hardly blame the financial crisis on Obama since he wasn’t in office when Lehman Brothers went down. And, the returns in the three months leading up to the election are five percentage points worse than they are after he’s elected. You might say that he caught a falling knife. If you exclude that election, then the Democrats look a lot like the Republicans. Of course, if you then exclude a Republican with some bad numbers, you get… less data and a lot of arguments.
And that’s my point about all of this: there’s not much data, which means that we don’t have much evidence about what will happen. I don’t think voters on either side have much to worry about over the long run – America prospers regardless of who’s in the White House.
I do worry about an unclean result where we don’t know who wins for a while, but the 2000 Bush/Gore election is somewhat instructive (except its only one data point!). At first, I looked at the volatility after the election, and it is the highest outside of 2008. But if you’ll notice, it was also the second-highest level of volatility going into the election. And the jump in volatility is the third highest, between Truman/Dewey in 1948 and Clinton/Dole in 1996.
The last point to remember is that Acropolis has managed our way through all kinds of results. Today will mark our fifth presidential election, but we’ve also dealt with different parties in Congress. Not only have we worked through different Presidential parties, but we also managed through mixed Congresses and sweeps in both parties across the executive and legislature.
In other words, we’ve got this!
