In addition to working with private clients, Acropolis has an incredible team of professionals who manage retirement plans, principally 401k plans (click here for more information).
I meet with some of the retirement plan trustees to discuss the plan’s investments. When we manage a plan, we want enough choices so participants can build a diversified portfolio but not so many choices that they are overwhelmed by the options and don’t make optimal decisions.
In US Equity, we typically offer three funds: a large-cap, a mid-cap, and a small-cap fund. Our large-cap fund is a simple S&P 500 index fund.
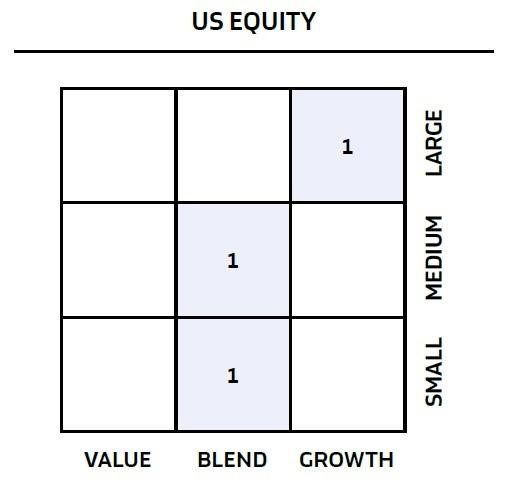
Historically, the S&P 500 has been considered a ‘blend’ of growth and value, as defined by Morningstar. Therefore, I was pretty surprised when I saw in our reports last quarter that Morningstar now classifies the S&P 500 index fund as a growth fund. The image below is a snapshot from our quarterly reports.

I’ve said before that I have a love-hate relationship with Morningstar. Their data and analysis are great, but they often oversimplify difficult topics, creating confusion for investors (their pervasive star ranking system is enemy number one in my book since everyone misunderstands what it tells them).
The chart above simplifies important academic research by Eugene Fama and Ken French that showed that fund returns can principally be explained by the size of the company (the market cap) and whether the stock is expensive or cheap (growth versus value).
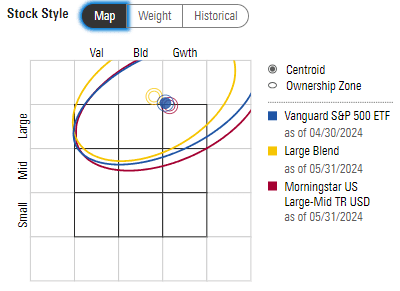
The chart is a good quick snapshot that tells you how the fund invests. But there are many devils in the details. The chart below is also from Morningstar and offers a little more detail. Here, you can see that the S&P 500 (as measured by the Vanguard 500 ETF) is barely out of blend and into growth.

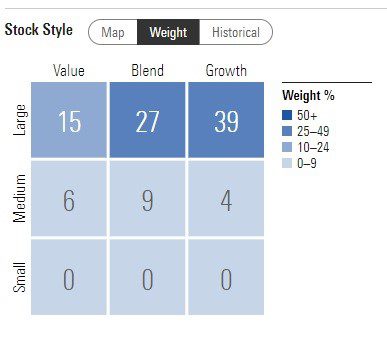
Morningstar has yet another way to look at the style box, as seen below, and it shows the weights of each category in the box. You can see how the way that Morningstar defines these categories, large cap growth is the largest sector, which is why it defines it that way in the charts above.

But here’s the thing – everyone defines these things differently. The academic work that I referenced above takes all of the stocks, divides them into equal thirds, and sorts them by how expensive they are: one-third of the stocks go into the cheap (or value) category, one-third go into the growth (or expensive) category, and the last third are neutral (or blend).
Morningstar doesn’t do it that way. In fact, their sort isn’t on a single valuation metric like the academics (who use price-to-book). Morningstar has five value metrics and five growth metrics.
Within value, forward earnings get a 50 percent weight, and price-to-book, price-to-sales, price-to-cash flow, and dividend yield get 12.5 percent each. Half of the definition is forward-looking, unlike the academics, which is all backward-looking.
The growth metrics are split in half first, too. Long-term projected earnings growth gets a 50 percent weight, and the other four metrics are equally weighted: historical earnings growth, sales growth, cash-flow growth, and book value growth.
This may be a little anti-climactic, but to answer the question in the subject line, is the S&P 500 a growth index? The answer is that it depends.
If you use the academic methodology, then no, the S&P 500 isn’t a growth index. However, with Morningstar’s methodology, it is because the largest stocks in the index are growing quickly (think Nvidia).
One of these days, I will take a look at how the Morningstar indexes correlate with the academic ones. I hypothesize that the value indexes look similar, but the growth indexes don’t, and it will be interesting to see.
The point today is that so much depends on how you measure things, and those details matter. That goes back to my love-hate feelings about Morningstar, but my feelings aren’t fair because they are just successful at popularizing their methodologies, and I should just give them kudos (is that close enough?).
Many thanks to Ryan for writing the last two weeks – I hope you all enjoyed them as much as I did!


