I was having breakfast the other day, and someone said they missed not having the 3,000 percent gain on Nvidia (NVDA) over the past five years.
Of course, I agreed, but then I returned to the office thinking that the return couldn’t have been that high. In fact, over the five years ending on June 28th, the cumulative return for NVDA was 2,926 percent, so I’ll give that to them. That equates to 97.6 percent in annualized terms.
It’s been a great five years for the S&P 500, up 15.0 percent during that same period, and even better for the technology sector, which is up 27.1 percent. However, NVDA was four times better than that on an annualized basis, and when you work that out cumulatively, the benefit turns to more than 10x over the tech sector and 30x for the market.
Although I lament not buying the stock, we have exposure through the ‘core’ S&P 500 index position. NVDA currently accounts for more than six percent of the index and has been a major contributor to its returns this year.
NVDA accounts for 44 percent of the S&P 500 return in the second quarter and 31 percent for the year’s first half. So, as long you had some broad market exposure, you got some of the benefits NVDA brought.
Of course, if NVDA falls apart for some reason (which feels impossible right now), we’ll also own that.
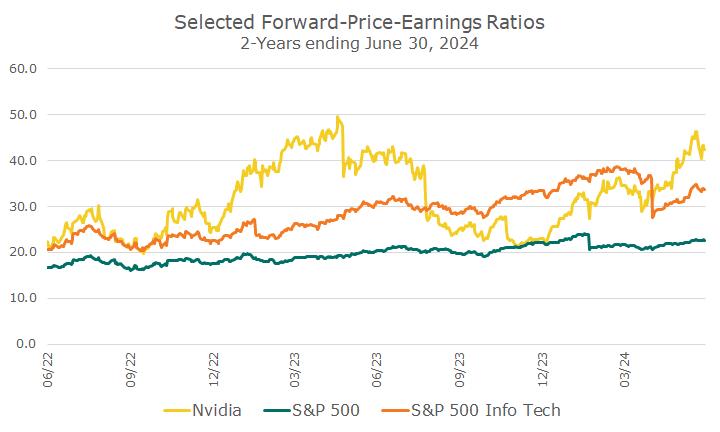
The chart above shows why it’s not really on our radar. It shows the forward PE ratio for NVDA, the S&P 500, and the tech sector. A forward PE looks at the price versus analyst expectations for earnings over the coming year.
The knock on forward PE ratios is that analysts are always too bullish on earnings, which makes the PE look better than it should in the eyes of the critics. For NVDA, analysts haven’t been bullish enough. Analysts baked in massive growth, but NVDA has consistently beat earnings, propelling the stock higher.
Even on this forward-looking basis, NVDA was ultra-expensive. The whole tech sector was very rich. There was a period at the end of last year where NVDA wasn’t as expensive as it had been and is now, but the worry then was that earnings would miss and the stock would crater.
When we buy stocks, we generally look for stocks within a sector that are cheaper than the sector as a whole. That’s hurt us over the last year or two on a relative basis because the best-performing stocks have been the expensive ones.
A piece from Dimensional Fund Advisors (DFA) did some research that made me feel even better.
They looked at the average annualized outperformance of the ten largest stocks in the index before and after they became one of the ten largest stocks.
In the ten years before a stock became one of the ten largest stocks, the annualized market outperformance was 11.8 percent. That’s how you get to be the largest!
However, on average, outperformance ended after joining the top ten list. In the three years following the top ten, stocks eked out 0.5 percent of yearly outperformance. After five years, they underperformed by -0.9 percent, and in the ten years after joining the top ten, they underperformed by -1.5 percent per year.
That fits with my personal experience. When I first entered the business, the ten biggest stocks included AT&T, General Electric, General Motors, IBM, and Altria. They’re all still household names, and while I didn’t run the numbers, I know that, on average, they haven’t done well.
It’s easy to imagine that NVDA will continue to execute for some time, just as some of today’s top stocks have done for the last decade. I’m glad I have exposure through the index, but I’m also glad that I don’t own it outright.
Have a wonderful Fourth of July!

- David Ott
- David Ott
- David Ott
- David Ott
- David Ott
- David Ott
- David Ott
- David Ott
- David Ott
- David Ott
- David Ott
- David Ott
- David Ott
- David Ott
- David Ott
- David Ott
- David Ott
- David Ott
- David Ott
- David Ott
- David Ott
- David Ott
- David Ott
- David Ott
- David Ott
- David Ott
- David Ott
- David Ott
- David Ott
- David Ott
- David Ott
- David Ott
- David Ott
- David Ott
- David Ott
- David Ott
- David Ott
- David Ott
- David Ott
- David Ott
- David Ott
- David Ott
- David Ott
- David Ott
- David Ott
- David Ott
- David Ott
- David Ott
- David Ott
- David Ott
- David Ott
- David Ott
- David Ott
- David Ott
- David Ott
- David Ott
- David Ott
- David Ott
- David Ott
- David Ott
- David Ott
- David Ott
- David Ott
- David Ott
- David Ott
- David Ott
- David Ott
- David Ott
- David Ott
- David Ott
- David Ott
- David Ott
- David Ott
- David Ott
- David Ott
- David Ott
- David Ott
- David Ott
- David Ott
- David Ott
- David Ott
- David Ott
- David Ott
- David Ott
- David Ott
- David Ott
- David Ott
- David Ott
- David Ott
- David Ott
- David Ott
- David Ott
- David Ott
- David Ott
- David Ott
- David Ott
- David Ott
- David Ott
- David Ott
- David Ott
- David Ott
- David Ott
- David Ott
- David Ott
- David Ott
- David Ott
- David Ott
- David Ott
- David Ott
- David Ott
- David Ott
- David Ott
- David Ott
- David Ott
- David Ott
- David Ott
- David Ott
- David Ott
- David Ott
- David Ott
- David Ott
- David Ott
- David Ott
- David Ott
- David Ott
- David Ott
- David Ott
- David Ott
- David Ott
- David Ott
- David Ott
- David Ott
- David Ott
- David Ott
- David Ott
- David Ott
- David Ott
- David Ott
- David Ott
- David Ott
- David Ott
- David Ott
- David Ott
- David Ott
- David Ott
- David Ott
- David Ott
- David Ott
- David Ott
- David Ott
- David Ott
- David Ott
- David Ott
- David Ott
- David Ott
- David Ott
- David Ott
- David Ott
- David Ott
- David Ott
- David Ott
- David Ott
- David Ott
- David Ott
- David Ott
- David Ott
- David Ott
- David Ott
- David Ott
- David Ott
- David Ott
- David Ott
- David Ott
- David Ott
- David Ott
- David Ott
- David Ott
- David Ott
- David Ott
- David Ott
- David Ott
- David Ott
- David Ott
- David Ott
- David Ott
- David Ott
- David Ott
- David Ott
- David Ott
- David Ott
- David Ott
- David Ott
- David Ott
- David Ott
- David Ott
- David Ott
- David Ott
- David Ott
- David Ott
- David Ott
- David Ott
- David Ott
- David Ott
- David Ott
- David Ott
- David Ott
- David Ott
- David Ott
- David Ott
- David Ott
- David Ott
- David Ott
- David Ott
- David Ott
- David Ott
- David Ott
- David Ott
- David Ott
- David Ott
- David Ott
- David Ott
- David Ott
- David Ott
- David Ott
- David Ott
- David Ott
- David Ott
- David Ott
- David Ott
- David Ott
- David Ott
- David Ott
- David Ott
- David Ott
- David Ott
- David Ott
- David Ott
- David Ott
- David Ott
- David Ott
- David Ott
- David Ott
- David Ott
- David Ott
- David Ott
- David Ott
- David Ott
- David Ott
- David Ott
- David Ott
- David Ott
- David Ott
- David Ott
- David Ott
- David Ott
- David Ott
- David Ott
- David Ott
- David Ott
- David Ott
- David Ott
- David Ott
- David Ott
- David Ott
- David Ott
- David Ott
- David Ott
- David Ott
- David Ott
- David Ott
- David Ott
- David Ott
- David Ott
- David Ott
- David Ott
- David Ott
- David Ott
- David Ott
- David Ott
- David Ott
- David Ott
- David Ott
- David Ott
- David Ott
- David Ott
- David Ott
- David Ott
- David Ott
- David Ott
- David Ott
- David Ott
- David Ott
- David Ott
- David Ott
- David Ott
- David Ott
- David Ott
- David Ott
- David Ott
- David Ott
- David Ott
- David Ott
- David Ott
- David Ott
- David Ott
- David Ott
- David Ott
- David Ott
- David Ott
- David Ott
- David Ott
- David Ott
- David Ott
- David Ott
- David Ott
- David Ott
- David Ott
- David Ott
- David Ott
- David Ott
- David Ott
- David Ott
- David Ott
- David Ott
- David Ott
- David Ott
- David Ott
- David Ott
- David Ott
- David Ott
- David Ott
- David Ott
- David Ott
- David Ott
- David Ott
- David Ott
- David Ott
- David Ott
- David Ott
- David Ott
- David Ott
- David Ott
- David Ott
- David Ott
- David Ott
- David Ott
- David Ott
- David Ott
- David Ott
- David Ott
- David Ott
- David Ott
- David Ott
- David Ott
- David Ott
- David Ott
- David Ott
- David Ott
- David Ott
- David Ott
- David Ott
- David Ott
- David Ott
- David Ott
- David Ott
- David Ott
- David Ott
- David Ott
- David Ott
- David Ott
- David Ott
- David Ott
- David Ott
- David Ott
- David Ott
- David Ott
- David Ott
- David Ott
- David Ott
- David Ott
- David Ott
- David Ott
- David Ott
- David Ott
- David Ott
- David Ott
- David Ott
- David Ott
- David Ott
- David Ott
- David Ott
- David Ott
- David Ott
- David Ott
- David Ott
- David Ott
- David Ott
- David Ott
- David Ott
- David Ott
- David Ott
- David Ott
- David Ott
- David Ott
- David Ott
- David Ott
- David Ott
- David Ott
- David Ott
- David Ott
- David Ott
- David Ott
- David Ott
- David Ott
- David Ott
- David Ott
- David Ott
- David Ott
- David Ott
- David Ott
- David Ott
- David Ott
- David Ott
- David Ott
- David Ott
- David Ott
- David Ott
- David Ott
- David Ott
- David Ott
- David Ott
- David Ott
- David Ott
- David Ott
- David Ott
- David Ott
- David Ott
- David Ott
- David Ott
- David Ott
- David Ott
- David Ott
- David Ott
- David Ott
- David Ott
- David Ott
- David Ott
- David Ott
- David Ott
- David Ott
- David Ott
- David Ott
- David Ott
- David Ott
- David Ott
- David Ott
- David Ott
- David Ott
- David Ott
- David Ott
- David Ott
- David Ott
- David Ott
- David Ott
- David Ott
- David Ott
- David Ott
- David Ott
- David Ott
- David Ott
- David Ott
- David Ott
- David Ott
- David Ott
- David Ott
- David Ott
- David Ott
- David Ott
- David Ott
- David Ott
- David Ott
- David Ott
- David Ott
- David Ott
- David Ott
- David Ott
- David Ott
- David Ott
- David Ott
- David Ott
- David Ott
- David Ott
- David Ott
- David Ott
- David Ott
- David Ott
- David Ott
- David Ott
- David Ott
- David Ott
- David Ott
- David Ott
- David Ott
- David Ott
- David Ott
- David Ott
- David Ott
- David Ott
- David Ott
- David Ott
- David Ott
- David Ott
- David Ott
- David Ott
- David Ott
- David Ott
- David Ott
- David Ott
- David Ott
- David Ott
- David Ott
- David Ott
- David Ott
- David Ott
- David Ott
- David Ott
- David Ott
- David Ott
- David Ott
- David Ott
- David Ott
- David Ott
- David Ott
- David Ott
- David Ott
- David Ott
- David Ott
- David Ott
- David Ott
- David Ott
- David Ott
- David Ott
- David Ott
- David Ott
- David Ott
- David Ott
- David Ott
- David Ott
- David Ott
- David Ott
- David Ott
- David Ott
- David Ott
- David Ott
- David Ott
- David Ott
- David Ott
- David Ott
- David Ott
- David Ott
- David Ott
- David Ott
- David Ott
- David Ott
- David Ott
- David Ott
- David Ott
- David Ott
- David Ott
- David Ott
- David Ott
- David Ott
- David Ott
- David Ott
- David Ott
- David Ott