Every six months, Standard & Poor’s does an analysis of how active funds compare to S&P indexes and it’s been a while since I’ve reported on the results. Unfortunately for the actively managed funds community, things haven’t gotten any better since my last update.
The report offers many details and if you want to look at the entire report, click here. I think that if you aren’t going to look at the whole thing there are two items worth highlighting, which I’ve pulled out and put into the two tables below.
The first table shows the five year results for US funds ending on Dec 31, 2015 and shows the frequency and magnitude of fund underperformance.
The frequency is captured in the first column of data; you can see that 84.2 percent of actively managed large cap funds underperformed the S&P 500. Mid cap managers fared a little better with only 76.7 percent of managers losing to the S&P 400 and the small cap managers fared worst with a full 90.1 percent of fund managers underperforming the S&P 600.
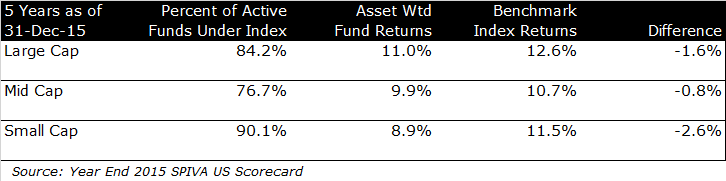
The magnitude of the underperformance is captured in the remaining columns. If you look at the returns on an asset weighted basis, actively managed mutual funds earned 11.0 percent compared to the 12.6 percent return for the S&P 500, an underperformance of -1.6 percent per year.
Again, mid cap fund managers fared a little better with a -0.8 percent annual lag and small cap investors really took it on the chin, falling behind the index by -2.6 percent per year.
In all, it was a bad year for actively managed mutual fund managers in both the percentage of funds that underperformed and the magnitude of the underperformance.
I will say that the numbers are a little biased because all three indexes are picked by a committee at S&P and have quality characteristics that the overall market doesn’t have.
An academic index of small cap stocks (CRSP 6-8 for you nerds), the performance is 9.5 percent for the same period. That’s still better than the collection of actively managed by 0.6 percent per year, but it closes the gap a lot and tells you more about the index than the managers.
The academic index for large and mid-cap closely mimic the S&P benchmark returns because the S&P committee can’t screen out as many names. There are thousands of small cap stocks that they pull from to create an index with 600 constituents.
I like to look at five-year numbers because I think that it’s a bit of a crapshoot in any given year – I would expect half of the managers to underperform and half to outperform over such a short period. I would like to look at a five-year rolling history, but I can’t pull that data from the report, so I thought I would settle with one year numbers.
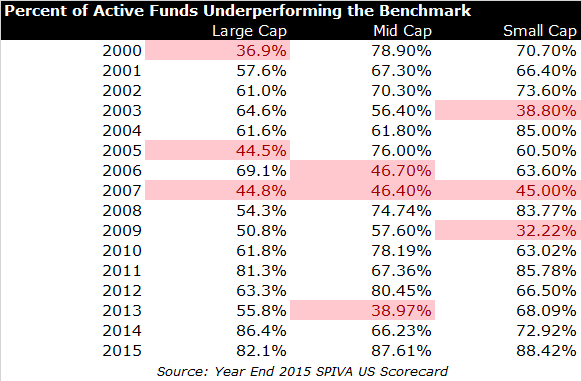
My half-and-half hypothesis turns out to be false. For all three domestic indexes, the active management community only manages to beat the index 20 percent of the time. I’ve highlighted the years where the majority of funds beat the index, and other than 2007, it’s fairly sporadic (and even the 2007 result is chance in my view).
I’ll keep reviewing the SPIVA reports as they are released even though I don’t imagine much change in the coming years. But you never know and no matter how good you think your strategy is, it’s always useful to be on the lookout for shifts in the ever-changing market.