The other night while washing the dishes, I had the thought that St. Louis is a mid-cap, meaning that the size of our fine city is roughly equivalent to a mid-sized US company. It’s a weird thought, but I thought it would be fun to carve up US cities the same way that researchers carve up the capitalization of the stock market.
I started at Wikipedia with a list of all US cities. I quickly realized that this wouldn’t work because this particular list breaks up St. Louis city and St. Louis County, an artifact that makes our crime rate look terrible. If you only look at St. Louis city, our murder rate ranks 19th in the world and first in the U.S.
That leads me to lesson number one: understand the data that you’re evaluating. A better data set is a list of ‘primary statistical areas’ (PSA) as defined by the US Office of Management and Budget (OMB). Excluding Puerto Rico, there are 567 PSAs in the US.
Measured this way, St. Louis includes St. Louis city and county along with St. Charles County and another eight counties that I mostly know from watching weather events in progress on the local news.
In PSA terms, St. Louis is the 21st largest ‘city’ in the country, with a total population of 2.9 million out of 289.6 million Americans living in PSAs, based on 2010 census data. That’s about what I had thought in terms of the ranking; now for the fun part: figuring out whether we are a ‘mid-cap’ or not.
When academics split up the market into deciles for study, they take the total number of publicly traded stocks and divide them into 10 equally sized groups. It actually gets quite complicated as I discovered last night while researching this article, but this is the basic idea.
So if there are 4,000 stocks in the US, that means they will be grouped into 10 equally sized groups of 400 companies. Applying the same concept to our cities, we’ll be looking at 10 groups of 57 cities (or PSAs more technically).
In stocks, the two largest deciles are considered large cap, which means that St. Louis is actually a ‘large cap’ city because the top two deciles of PSAs will include 114 places and we easily fit into that group.
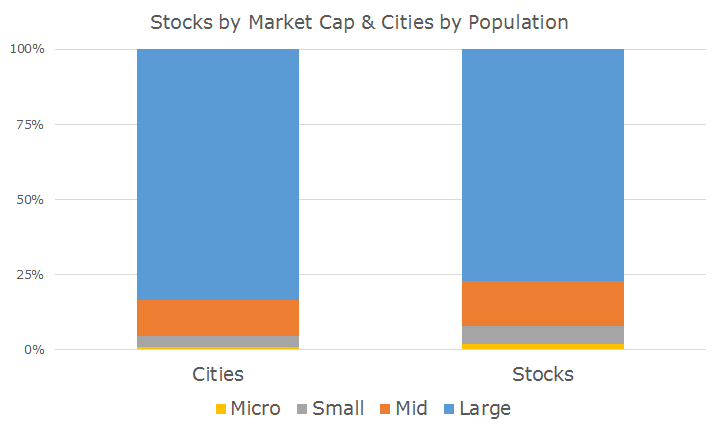
So while my question is easily answered, I did bump into an interesting coincidence. If you look at the total market value of the top two deciles, or large cap stocks, they have historically been worth about 77 percent of the overall stock market. Somewhat amazingly, the population of the two largest deciles of cities is equal to about 83.5 percent of the overall population.
The similarities didn’t end there: mid cap stocks are historically worth 12 percent of the total market, and the population of mid-sized cities is 14.8 percent of the total population. There’s a bit of divergence in small cap/cities with 3.4 and 6.2 percent respectively and micro-cap where the numbers are one and 1.8 percent respectively.
While there are some differences, the chart below shows a surprisingly similar picture.
While there’s no secret discovery here or brilliant new insight, I thought it was a fun way to look at the cities the same way we look at stocks.
Sadly, there’s no additional return for investing in microcap cities like Corinth, MS or Batesville, AR like there has been for microcap stocks, and I don’t think you would say that these places are riskier than New York City or LA even though I haven’t heard of these little places with populations of about 36,000.
I am proud to think that St. Louis is firmly large-cap instead of a mid-capper like those hayseeds in Cedar Rapids, IA or Macon, GA. Just kidding – no need to send complaint emails if you’re from one of those lovely (mid-cap) towns.
If you want to poke fun at me here in St. Louis, you can just say that the 21st largest stock is Citigroup, which over the past decade has hardly been something to be proud of (reminder: they were bailed out no less than three times).