Last year at this time, I was heartily in the camp that the US would enter a recession in 2023. I’m always fine being wrong (it happens more than I care to admit), but I’m especially happy that we didn’t enter a recession.
Part of my thinking is a chart that we will see a later in this Insight that shows the drawdown of Leading Economic Indicators. I won’t bury the lede, though, and tell that the signal is worse now than a year ago, despite the current conventional wisdom that we’ll avoid a recession.
In fact, we can see it on the first chart, which shows the history of the Leading Economic Indicator (LEI) and it’s sibling, the Coincident Economic Indicator (CEI).
The CEI includes economic variables that tend to change at approximately the same time as the overall economy and intend to give a sense of the overall economy.
Examples of indicators in the CEI include nonfarm payroll employment, the unemployment rate, average hours worked in manufacturing, and wages and salaries.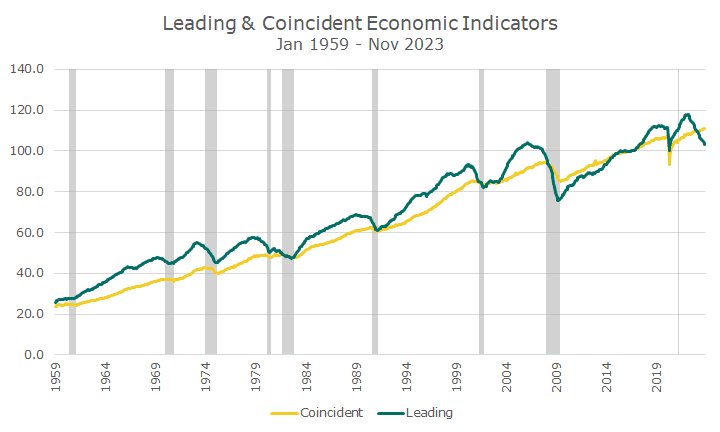
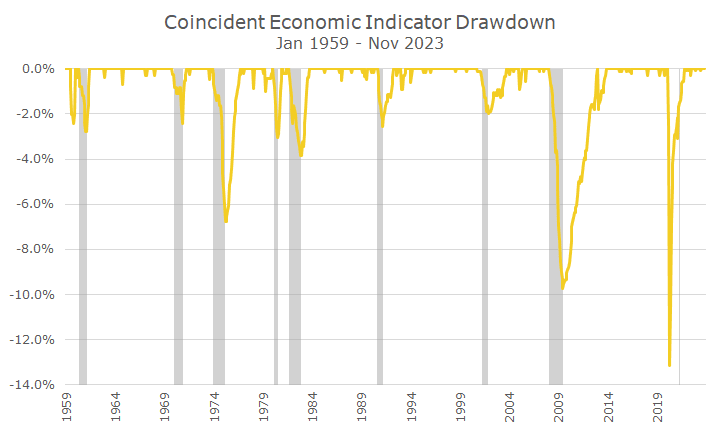
The chart above does a nice job of showing the CEI in relation to recessions, which are highlighted in grey, but I like to dive in and look at how much an index like this drops in and around recessions, which is shown in the next chart.
Overall, I’d say that the indicator does a pretty good job of showing up during recessions. Interestingly, other than the pandemic (which is a very special case), the depth of the indicator drawdown appears related to the duration of the recession.
While interesting, the LEI gets more attention because we all want to know when we’re heading into a recession BEFORE it happens. Knowing at the same time is nice, but the LEI attempts to forecast a recession.
The LEI is comprised of financial and non-financial components. The S&P 500, the spread between the yield on the 10-year Treasury and Fed funds, and the leading credit index are all financial components. Non-financial components include ISM Index of new orders, building permits, and weekly initial jobless claims, to name a few.
I’ve shown the data in a drawdown format again, and my conclusion is that the LEI does give some advance warning, which is why I thought it signaled a recession at this time last year.
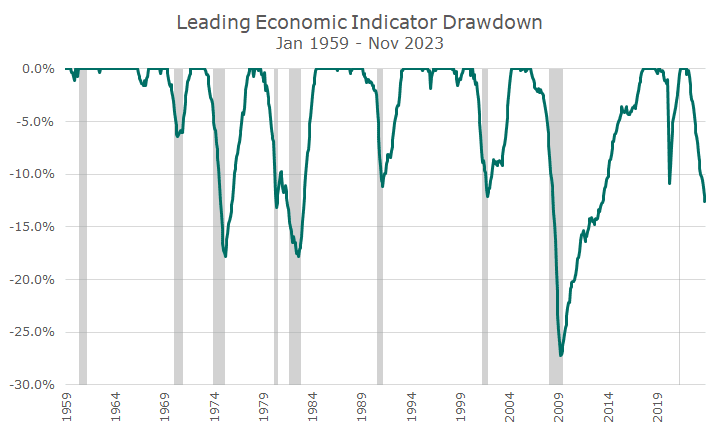
The magnitude of the current drawdown is pretty compelling. Last year, I said it had never had a five percent drawdown without a recession. Now the LEI is down more than 10 percent from its peak.
I admit that I’m not sure what to make of it, but my conclusions are that we’re near the end of the current business cycle. How near the end is more difficult to answer. Charts like this don’t help because a year looks like no time at all, but when you live a year, a lot happens.
Later this month at our Investor Social, I’m going to ask the audience their prediction for 2024. It’s a savvy group who called for no recession in 2023, when two-thirds of professional economists said there would be one.
I’m also going to reveal what the six partners think since that was one of the questions an audience member asked last year. I won’t reveal what we say as a group, but I’ll say that I’m in the no recession camp for 2024.
I was wrong last year, and may be wrong again this year, who knows. Maybe the best lesson from the LEI is that there are still risks out there and we shouldn’t go whole hog on anything (unlike the Bitcoin folks, who are RISK ON).
Probably the biggest lesson is that the indicators are interesting, but we don’t trade on them. We would have missed a big upward move last year if we did. Maybe this year will be down, and we’d miss that too, but maybe not. Who knows… Not me and I’m fully invested anyway.

David is a trusted advisor to 50 families, delivering comprehensive financial solutions, including financial planning, investment management, cash management, tax planning, estate planning, and charitable giving. As Chief Investment Officer, he leads the Investment Committee and the research and trading team. His team continuously evaluates investment strategies and securities, working closely with Portfolio Managers to implement them effectively.