A few weeks ago, I was in a meeting and someone said, “why talk so much about the bond market? Who cares?”
Of course, we care about the bond market because 30 percent of the money that we invest is in bonds, so we are bound to keep track of it. And, as former bond traders, it feels natural.
I understood the question, though, because the stock market is where the real wealth generation comes from, although bonds act more like a wealth preserver. Plus, stocks are 4-5 times more volatile than bonds, so it’s where all of the ‘action’ is, in that sense.
The bond market lets us know what bond investors are thinking, which is useful because the bond market is actually bigger than the stock market, and bond investors typically have a mix of stocks and bonds, as we do.
Bond investors signal where they think the Fed will take rates, by looking at the two-year Treasury note. They tell us what they think inflation will be, based on the regular and inflation-protected Treasury bonds.
And, bond investors signal their view of the economy based on the difference in yield between Treasury and junk bonds (formally known as High Yield bonds). Junk bonds are bonds issued by non-investment grade companies, whose financial position won’t allow their bonds to be rated AAA, AA, A, or BBB (forgetting the +/- for each grade).
The chart below shows this yield difference, known as a ‘spread’ back to 1997 when this index was created. I realize that the title is full of unintelligible words, but it’s basically the junk bond yield minus the Treasury yield, courtesy of the St. Louis Federal Reserve.
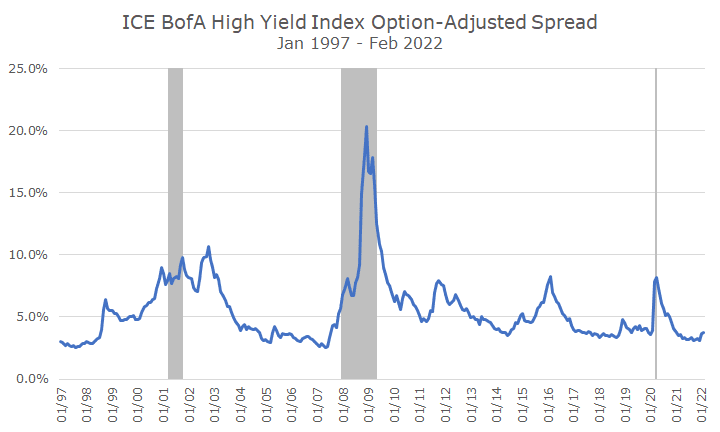
Even a casual observation of the chart shows the junk spread is really high in recessions (indicated by the gray shading), and lower outside of a recession.
And if you think about it, that makes see because junk bond issuers are the shakiest borrowers and most susceptible to changes in the economy. A triple-A borrower is in such a good financial position that it almost doesn’t matter what’s going on with the economy because they are so insulated from current events. There aren’t many triple-A companies anymore.
By the time you get down to junk bonds, the borrowers are pretty shaky, so you can bet that the investors who buy these bonds keep pretty close tabs on how the companies are doing. And soft patches in the economy hit these companies harder, and that translates into lower junk bond prices, and, therefore, higher yields on junk bonds.
You can see in the 2008 global financial crisis, the junk spread got to 20 percent, which was pretty historic. It also makes sense because the economy was terrible and a lot of companies were expected to default. The yield for junk investors needs to cover all of the defaults or they might as well invest in Treasury bonds.
As the economy got better, the spread fell back to more typical levels. When the pandemic hit, you can see spreads moved sharply higher, which made sense because the economy was in bad shape and the extent of government intervention wasn’t clear at that point.
Over the history of this index, the average spread is 5.4 percent, but that overstates what’s ‘normal,’ so the median level of 4.8 percent is probably a better estimate. There’s also a lot of noise around the average, so it’s useful to look at a range to define normal, and I’d say that’s between 2-7 percent.
That’s such a wide band that it doesn’t contain a ton of information, which is why we don’t trade on this information. If this were the only thing that you needed to look at to understand the economy, it’s all that we would look at, and, of course, everyone looks at a lot of indicators.
Still, I like it because it’s simple, intuitive, market-based, and gives me a sense of where things stand at the moment. And, at the moment, I read the spread as elevated, but still normal. The recent uptick signals some kind of change, which makes sense, but you can see that there are a lot of upticks that didn’t signal a recession, which is why I still say normal.
That doesn’t mean that something could be around the corner, though – just take a look at how quickly the spread changed in 2008 and again at the pandemic. This isn’t a magic indicator, but it’s still worth taking a look at in my opinion.