One way to judge the performance of a mutual fund or ETF is to compare the results to a relevant benchmark, which is usually an index that has relatively similar characteristics.
Another method is to compare your fund to a group of funds that are basically pursuing the same strategy. Admittedly, we don’t use this approach very often, even though I think it would make our job a lot easier since categories of funds frequently don’t fare as well as the benchmarks.
For example, the Vanguard 500 index fund trailed its benchmark by 0.04 percent over the five years ending in February, but beat 75 percent of the other funds in its category by an average of 1.55 percent.
Sometimes, though, an entire category can beat the benchmark; a current case in point is the Vanguard Total Bond Index fund. This fund seeks to match the performance of the Barclays Aggregate bond index, minus the fees of 0.20 percent (for the retail investor share class).
Over the five years ending in February, it has met this goal: the index earned 4.29 percent and the fund earned 4.13 percent (which was actually a difference of -0.16 percent, a little better than you might expect).
It’s easy to feel good about those results until you look at the category return, which was 4.61 percent, which beats the Vanguard fund by 0.48 percent per year, placing the Vanguard fund in the 28th percentile of funds in the category.
Knowing that it’s hard to beat the market, just how are 72 percent of bond fund managers in this category beating the market?
We’ve said before that bond risk and returns can basically be broken down into two categories, term risk and credit risk.
Term risk refers to the maturity (or more technically, duration) of a bond – the longer the term, the riskier the bond. If rates go your way, that risk equals return, but if they go against you, you’re facing losses.
Credit risk refers to the chance that the entity issuing a bond, a corporation, government or otherwise, won’t make the expected interest payments or pay you back at maturity.
A bond fund manager, therefore, basically has two levers to pull between when they are trying to beat the market. Not many people want to take term risks these days given how low rates are (although this was a popular bet for the last 30 years), so most managers are taking credit risk.
All of the bonds in the Barclays Aggregate index, and, therefore, the Vanguard bond fund, are investment grade – there are no junk bonds. Furthermore, 70 percent of the bonds are AAA, which mostly means government related paper.
When you look at the credit quality of the bonds held by all of the managers in the category, it’s a different story: about five percent are junk bonds and only 45 percent of them are AAA. In short, there’s a lot more credit risk.
That’s been working well for the last five years, but corporate bonds are sensitive to recessions, like stocks, because corporations are losing money and the risk that they can’t make payments goes higher.
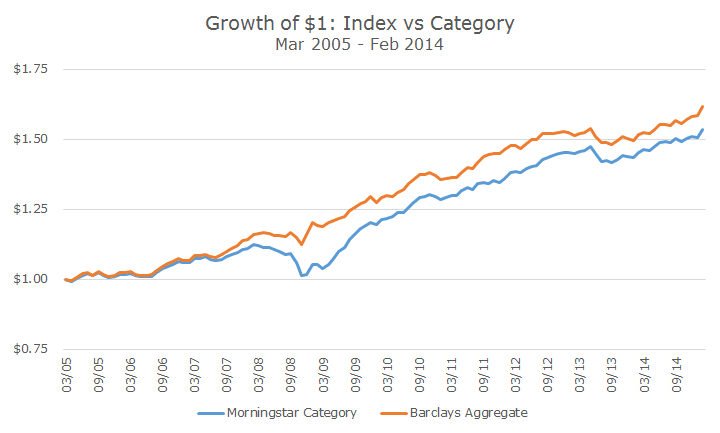
In the chart below, you can see that the category of funds lost money in 2008, actually losing -4.7 percent while the Barclays Aggregate made 4.24 percent.
As the chart shows, all these years later, the category still hasn’t caught up to the Aggregate.
I’m not actually saying that corporate bonds are bad – we are actually overweight them compared to the Aggregate too, though not by as much.
I’m simply saying that when you look at category returns, it’s much harder to compare results on an apples-to-apples basis. Looking at category returns can be useful, especially in esoteric strategies (which the bond market is not), but as always, you have to know what you’re looking at if you want some useful information out of it.

David is a trusted advisor to 50 families, delivering comprehensive financial solutions, including financial planning, investment management, cash management, tax planning, estate planning, and charitable giving. As Chief Investment Officer, he leads the Investment Committee and the research and trading team. His team continuously evaluates investment strategies and securities, working closely with Portfolio Managers to implement them effectively.