One of the bedrock ideas behind Modern Portfolio Theory (MPT) is that diversification lowers risk.
A simple view of that concept is that a portfolio of many stocks is less risky than a portfolio that contains one stock because the impact of a failure like Lehman Brothers or Enron won’t blow apart your whole portfolio. Of course, all stocks can go down substantially, like they did in 2008, so diversification doesn’t eliminate risk.
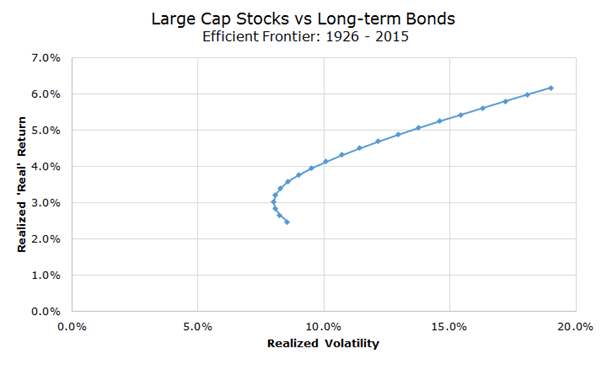
A more nuanced view of the same idea is that if two assets aren’t perfectly correlated, the portfolio volatility that contains both assets will be lower than the volatility of each asset individually. The chart below helps illustrate the concept.
The chart above is a classic image in finance. It plots the risk and return characteristics for portfolios with various weights of stocks and bonds. To create this chart, I took the realized returns adjusted for inflation for large cap stocks and long-term bonds from Ibbotson & Associates from 1926 to March of 2015.
(A quick thanks to all of our summer interns, but particularly to Griffin Diemer who actually put all of this data together for me and helped out with the analysis).
Each dot on the chart represents a portfolio with a different mix of stocks and bonds. The top right position is 100 percent stocks and has the highest realized real return and the highest realized volatility.
At the other end of the spectrum is a portfolio that is 100 percent bonds. While it has the lowest realized real return as seen on the y-axis, notice that it doesn’t have the lowest realized volatility, which can be seen on the x-axis.
The portfolio with the lowest realized volatility is actually the portfolio with a 15/85 stock/bond mix.
Investors who want the lowest volatility, therefore, shouldn’t invest in a portfolio of only low risk assets because including some high risk assets lowers overall portfolio volatility when the two assets don’t move in lockstep with each other.
Interestingly, the lowest risk portfolio isn’t necessarily optimal either – for investors who want to earn the most unit of return for each unit of risk (or maximize the Sharpe ratio), they should have invested in the mix that was 35 percent stocks and 65 percent bonds.
That’s the fundamental idea behind the famous paper by Harry Markowitz in 1952, simply titled ‘Portfolio Selection.’
While the idea is elegant and perfectly right, the problem is that we can only solve this equation with historical data or estimates for the future, which are both problematic for their own reasons – historical data tells us what happened in the past, but not what will happen in the future and estimates for the future will undoubtedly be wrong.
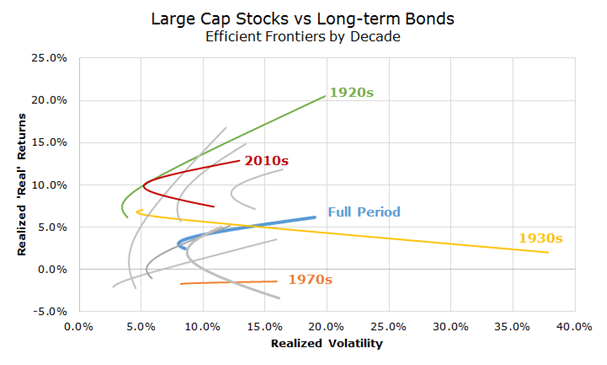
The chart above, while beautiful, only looks that way because it was created with eight and a half decades of data. To illustrate the sensitivity of the model and how different data changes the output, I plotted the same chart for each decade, seen below.
I only highlighted four decades, but you can see that the other grey scratches are all over the board (it was even crazier when I first ran it without inflation adjusted data). Notice that almost nothing looks like the full period from 1926 to 2015.
The 1920s, in green, look great with high returns, low volatility and a nice ‘hook’ that shows the diversification benefit. The 1930s, in yellow, looks nothing like the full period chart because stocks earned less than bonds, although there is still a tiny hook reflecting the benefit of diversification.
I’d love to say that you see the diversification benefit everywhere, but in the 1970s, there was no diversification benefit – all of the returns were less than zero after inflation and there is no ‘hook’ showing the benefit of diversification.
The current decade, though not finished, has a very nice hook with above average returns and below average volatility.
Ultimately, I’m a firm believer in the theory and we diversify across a much broader spectrum of assets to try and reduce risk, both in simple and nuanced terms.
At the same time, I also have come to believe that there isn’t much precision in these kinds of models because the output is incredibly sensitive to the inputs and it’s far from clear what the inputs should be.
If you tell me the assets and time period that you want to evaluate, I can tell you with 100 percent accuracy what the best portfolio was in terms of the highest return, lowest risk or the optimal combination, but I can’t tell you very much about the future because I don’t know what the returns, volatility or correlations will be.
The uncertainty about the model doesn’t make the theory incorrect; although ignoring this fundamental concept would be like throwing the baby out with the bathwater.
The good news, though, is that when you’re unsure about what to do, a good answer is to diversify you assets.


