Seeing the DJIA at 18,000 reminds me of a book published at the peak of the internet bubble titled, ‘Dow 36,000: The New Strategy for Profiting from the Coming Rise in the Stock Market,’ by James Glassman and Kevin Hassett.
At that point, the DJIA was about 11,000, so it only had to little more than triple to hit the 36,000 mark. I had graduated from college in 1995 when the DJIA was about 4,500, which meant that the DJIA had nearly tripled in the four years that I had been working. It seemed both outlandish and conceivable that the DJIA could hit 36,000 in short order.
I actually thought the title was clever because as long as they never said the timetable, at some point, the index would surely reach that level. It might take 100 years, but the DJIA would make it to 36,000 eventually. As it turns out, that day still hasn’t come – we’re only half way there after 16 years from publication.
Although I never read the book, it was so well known as the poster-child of internet bubble mentality that I know its premise.
The authors argued that investors would finally come to realize that stocks aren’t risky, would no longer require additional compensation for holding stocks and would, therefore, be willing to pay much, much more than current market prices at that time.
In the introduction they wrote that they would ‘convince you of the single most important fact about stocks at the dawn of the 21st century: they are cheap.’ Well we all know how that turned out. Stocks weren’t cheap and I think the whole world was reminded that stocks are, in fact, risky. They said, as others have before them, that if you look at stock returns over 20-30 year time horizons, they (almost) always beat other asset classes and are ‘safe’ if you have the right attitude about time.
Getting back to my idea that the DJIA should eventually reach 36,000, I thought it would be fun to see just how long it might take. Of course, I have no idea how long it will take because it will depend on performance.
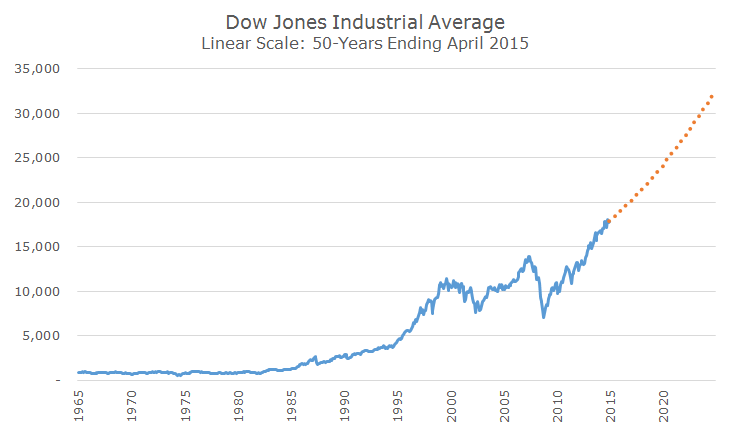
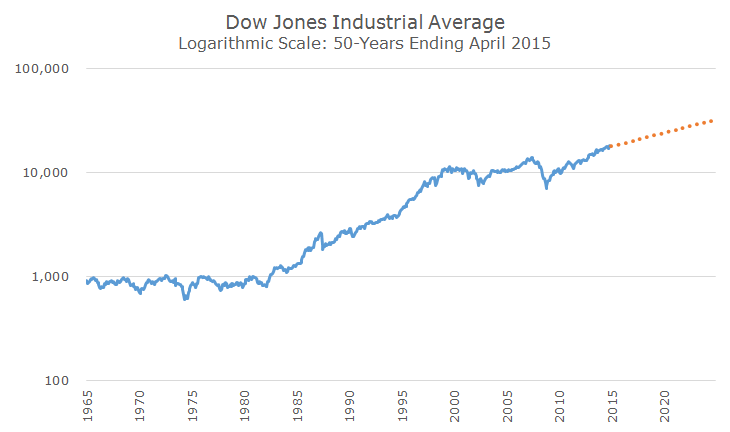
In the charts, I simply looked at the average monthly price-return (the index doesn’t include dividends, so I didn’t either) for the past 50 years and assumed that they earned as much going forward. If that happens, it would be another 12 years before the DJIA hit 36,000, just shy of the 30th anniversary of the publication date of the book.
If you’re like most people, you’re probably spooked out by chart because it just goes straight up from here. That’s true – I didn’t apply any volatility to the return, which is indicated in orange. Obviously, stocks are still risky and will continue to be volatile.
I used the same data to make the following chart, which makes the ride to 36,000 look a little less scary. In this version, I used a logarithmic scale, which I think makes more sense. Looking at the first chart, you can’t even see stocks doubling from 1,000 to 2,000 because the scale is so off. The second chart corrects for that and isn’t so frightening.
Remember, I have no opinion about when stocks might get to 36,000. I think they will get there because I’m an optimist. But I’m also a realist and know that it could be a very, very long time and it won’t likely be a smooth ride from here.


