While inflation may or may not have peaked, Federal Reserve officials are still talking about raising interest rates.
Several Fed officials called for rate hikes through 2023, and St. Louis Fed President said that the overnight rate should be four percent by the end of this calendar year (it’s currently between 2.25 and 2.50 percent).
Although the Fed is already raising rates, a process also known as tightening, I wondered what Fed tightening policy has on market returns.
I pulled the effective Fed Funds rate from the St. Louis Federal Reserve database (FRED) and looked at whether rates were rising (tightening), falling (easing), or standing still (neutral).
Here’s what tightening looks like:
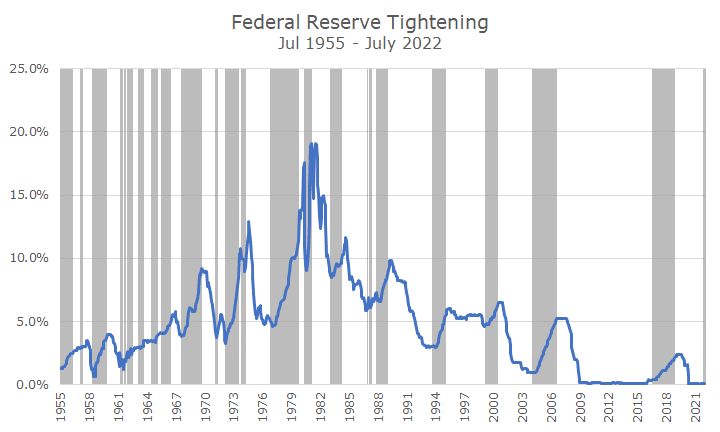
The effective fed funds rate is in blue, and I’ve highlighted my estimate of tightening in gray. You can see that it’s not perfect, but I think it’s pretty close.
The easing chart isn’t quite the mirror image of the tightening chart because it includes a special section in yellow, which represents quantitative easing when the Fed had rates at zero and bought bonds in the open market to keep rates low.
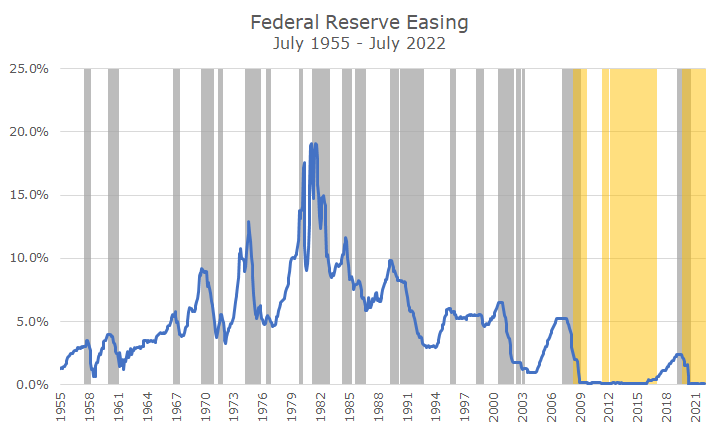
It’s a little odd because there are some periods of overlap. You can see that just after the 2008 financial crisis and the start of the pandemic, the Fed was cutting the Fed funds rate through their official policy action and buying bonds in the market through quantitative easing.
I’m not showing the neutral chart, but the short story is that there isn’t much neutral policy – they mostly hop between easing and tightening.
Once I defined the three periods (easing, tightening, and neutral), I looked at the average return for the S&P 500 and five-year Treasury notes. I used five-year Treasury notes instead of the Bloomberg Aggregate because the Agg only goes back to 1976.
The average monthly return for the S&P 500 during tightening periods was 0.4 percent. That compares poorly to the average monthly return of 1.3 and 1.1 percent for easing and neutral periods, but it’s still positive, suggesting that it still pays to hold stocks when the Fed is tightening.
The average volatility for stocks was essentially the same between tightening, easing, and neutral policy periods, so we shouldn’t expect markets to be choppier just for that reason.
I thought the bond market data would be different, but it was essentially the same: 0.4 percent for months when the Fed is tightening and 0.6 and 0.5 percent for periods when they are easing or neutral. The volatility was essentially the same as well.
I was relieved to see the results, but I want to make three important points.
First, this wasn’t an academic study with lots of robust checks. I think the analysis is satisfactory, but the finance and economic PhDs could surely find fault with it.
Second, by looking at the returns at the same time as the policy, you miss something important: market expectations. Markets started reacting to the current Fed tightening in January – months ahead of the actual tightening. We all know that markets anticipate Fed action, and I didn’t attempt to account for that in my analysis (cue the PhDs).
Third, we have no history of how markets will respond to quantitative tightening (QT). The yellow highlights how much quantitative easing we’ve experienced since 2008, but other than a relatively short period before the pandemic, we don’t know much about QT. The short period in the fourth quarter of 2018 wasn’t great, but I’d be careful about too much extrapolating.
My conclusion is that we should expect lower stock and bond returns as the Fed continues to tighten but keep holding them since the average returns are positive. While volatility during tightening isn’t abnormal, QT is a bit of a wild card.
On an unrelated note, I’ll be on vacation next week, so there will be no Daily Insights on the 22nd.

David is a trusted advisor to 50 families, delivering comprehensive financial solutions, including financial planning, investment management, cash management, tax planning, estate planning, and charitable giving. As Chief Investment Officer, he leads the Investment Committee and the research and trading team. His team continuously evaluates investment strategies and securities, working closely with Portfolio Managers to implement them effectively.