Private equity is in the news quite a bit, but finding the returns for this asset class is somewhat more challenging. There are a lot of stories about mega returns, but as they say at the University of Chicago, multiple anecdotes don’t make data.
Until recently, I only had small windows into the world of private equity returns. First, when private equity management firms like Blackstone, KKR, and the Carlyle Group went public, they published summary data in their quarterly filings.
For example, the most recent quarterly filing for KKR and their 25 funds (closed and operating) shows that the average net internal rate of return (IRR) net of fees is 18.9 percent (25.6 percent gross of fees). You can peruse their results on page nine if you click here.
Similarly, I found that the California Public Employees Pension System (CalPERs) publishes the returns for their private equity investments (click here for the performance data).
Unlike the quarterly filings mentioned above, you can see the results for 257 funds from dozens of providers. Some of the returns are eye-popping, like the 78.8 percent net IRR in the WLR Recovery Fund since 2002. They put $50 million in, have taken out $113.2 million and still have $120.8 million in the fund.
The trouble for CalPERs is that a $50 million investment is decimal dust in the context of a $304.4 billion portfolio. You just can’t move the needle with that position size, even with astounding results.
Their biggest cash commitment of $1.35 billion to the California Emerging Ventures II in 1999 didn’t fare nearly as well, earning an annual net IRR of just 3.9 percent.
As much fun as I have poking through both of these sources, the numbers don’t tell me what I want to know, which is how private equity does in general.
Recently, I came across some publicly available data from Cambridge Associates, a consultant to institutional investors. They’ve worked hard to create an index of funds, and while it isn’t perfect, I think it probably does reflect the returns for the asset class as a whole.
After manually entering the data into excel, I did some basic tests to see what private equity looks like over time. In short, it looks pretty good.
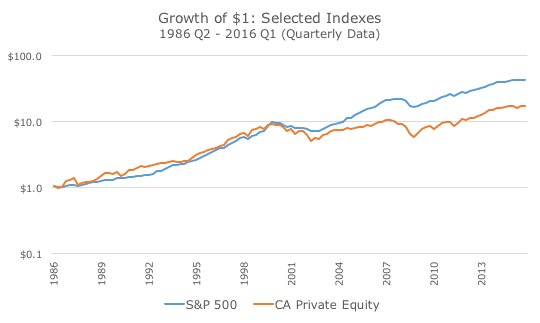
Since the inception of the index in 1986, the Cambridge Associated (CA) Private Equity Index earned 13.3 percent net of fees, compared to 9.9 percent for the S&P 500.
Because private equity isn’t priced every day like publicly traded stocks, the volatility is extremely low, with annualized volatility of 10.4 percent compared to 17.5 percent for the S&P 500. As a result, the Sharpe ratio (the excess return divided by volatility) for the CA index is 0.96, more than double the 0.37 Sharpe ratio for the S&P 500.
In addition to the high risk-adjusted returns, investment geeks will appreciate the relatively low correlation of the two (0.79) and that the beta to the S&P 500 is low at 0.41.
That’s the good news.
Here’s the bad news. First, you can’t buy the CA Private Equity Index. In fact, it isn’t even really an index – the returns that you see above are for a compilation of individual funds, much like a category return that you see on Morningstar. It’s a nuanced point, and while I’m not doing it justice here, the point is that you can’t buy an index fund that matches the asset class.
Second, almost all of the outperformance for the CA Private Equity index comes in a nine-year period that starts in 1999 and ends in 2008, and there are very long stretches of underperformance. The chart below shows what a dollar in the outperformance would have grown to over the life of the index.
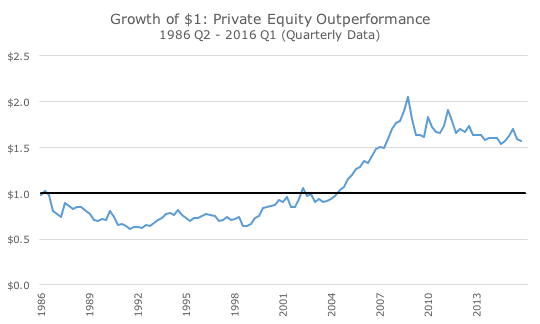
Notice that a dollar invested on day one would not have outperformed the S&P 500 until 2002. Anyone thinking that they will earn three percent more per year every year as the summary statistics would suggest should look at the 16-year underperformance of the index. Since the peak of the outperformance in 2008, excess returns have suffered again.
I’ve heard some large, well-known public equity managers say that this index isn’t very useful because there are a lot of lousy private equity managers out there. Instead, investors should focus just on the top quartile managers.
I don’t have the data for this subset of managers, but, duh, if you just look at the best managers, the numbers are going to look a lot better – the same is true for mutual funds.
Now, in the mutual fund world, there is very little (if any) persistence among top quartile managers. That may not be true in private equity – I just don’t know without more data.
I suppose that I could pay a consulting firm like Cambridge Associates for the data, but it doesn’t really matter for us since most of these funds are inaccessible to our clients due to extremely high minimums. Even if we could afford a few funds, it would be hard to build out a diversified portfolio of private equity funds.
There are some relatively new products available that are attempting to put private equity into more investor friendly wrappers (lower minimums, more liquidity, etc.). These funds are still expensive, still illiquid and too new for us to draw any conclusions.
As you might expect, though, I’ll be keeping a close eye on these products in the coming years to try and figure out whether the grass is truly greener in private equity, especially in the made-for-retail segment.