This past Wednesday, the Bureau of Labor Statistics released the Consumer Price Index (CPI) data for October, which showed inflation on consumer goods growing at a rate not seen in thirty years. This concerning trend is illustrated in the chart below. The orange line tracks the annual growth rate of the CPI since the 1960’s. This line includes all prices and categories. The white line tracks the same index, but strips out food and energy as they historically are very volatile categories. While the entire index approached these levels in 2007 due to sky high oil prices, the ex-food & energy, or core index, remained anchored close to 2%. Today, however, even the core index is rising at a 4.6% rate.

Some of this was certainly anticipated. The Federal Reserve continues to label inflation as “transitory,” expecting the rate of price increases to normalize closer to its 2% long run goal. Coming out of lock-downs and the precipitous fall from 2020, it only makes sense that many prices would rebound along with the economy in general. This is the basis for the transitory argument, that these rebounds are just getting us back on track from pre-covid and will soon return to normal.
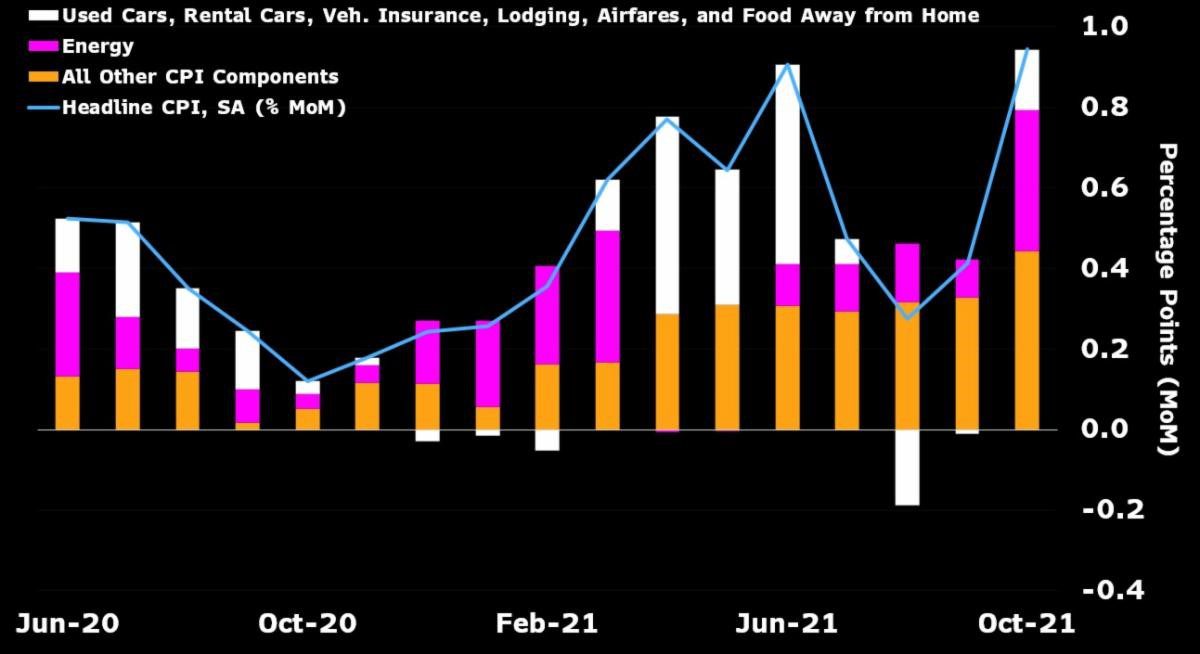
However, the upward trajectory of prices was much worse than expected and is causing many to question where we go from here. If we take a deeper dive into the data, an interesting trend appears. The following chart follows the monthly CPI index over the past year, but it shows the contribution of various categories for each month. We all know that energy, cars, travel and entertainment sectors have been very volatile over the past year. Oil prices have gone from negative to over $80/ barrel, used cars are appreciating in value as supply chain problems plague new car production, and travel and entertainment is seeing booming demand post-lockdowns, yet is suffering from a shortage of workers at the same time. As the post-lockdown economy has boomed, it is not surprising that these sectors have had a large influence on the CPI. This is illustrated by the white and purple bars in the chart below.
The gold bars include the contributions of everything else in the index. For 2020 and the beginning of 2021, inflation was well contained to just those volatile sectors. However, this trend has been changing since May, with inflation becoming much more widespread throughout the economy. This is where policymakers should become concerned.
October Contributions to CPI
The next chart gets even more granular. Cost of shelter, including rent and a computed rent for homeowners, accounts for nearly a third of the CPI. Rent is sticky and very slow to move as it relies on contract renewals. Owner equivalent rent is calculated by the BLS and often has large lags to the housing market in general. This part of the CPI has begun to increase and is likely to continue increasing for the foreseeable future. If the market-based Observed Rent index published by Zillow is any indication, there will continue to be upward pressure on the CPI for some time to come.

The transitory argument made sense when the higher inflation numbers where being driven by one or two factors such as used car prices or energy. These could be explained as market dislocations that would resolve over time. However, for the past six months, the growth in inflation has become much more widespread with the risk of being more sticky.
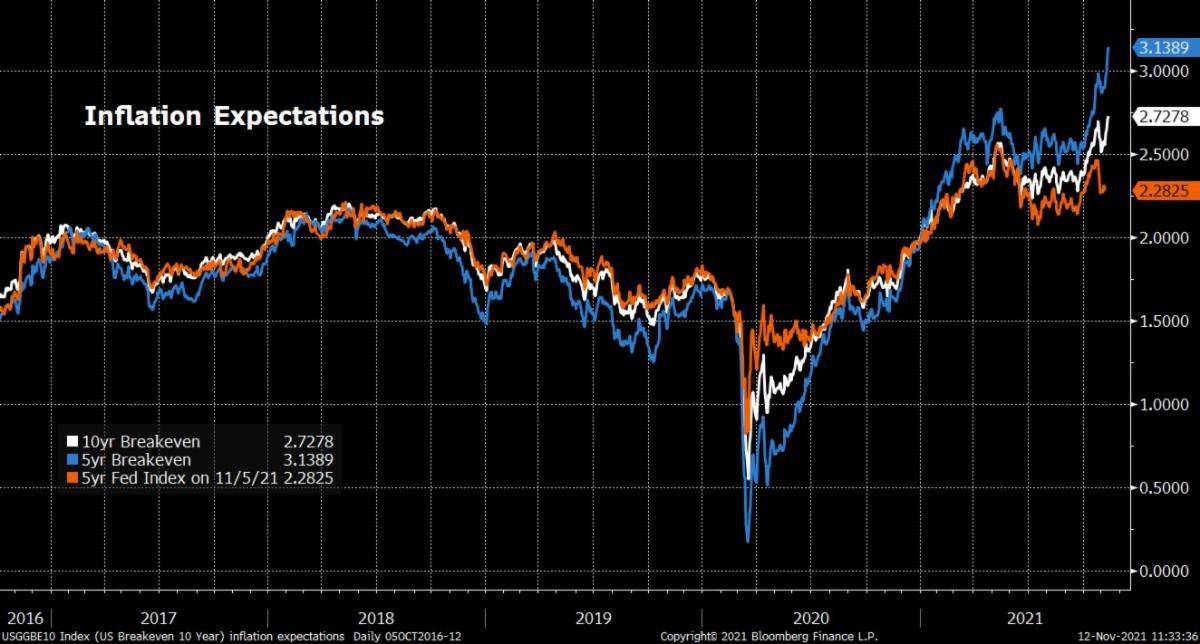
The market agrees with this view, as market-based expectations for future inflation have been rising (chart below). Currently, the market is expecting inflation to average more than 3% annually over the next five years and average about 2.75% over the next 10. Therefore, it appears as if the market is pricing in a high level of inflation over the short term, with it slowly moving towards the Fed’s goal of 2.5% over the long run. It appears the market still has confidence in the Fed to keep inflation under control for the long term… which is good.
Where do we go from here?
Based on the data posted above, it would be reasonable to expect the CPI to remain elevated over the short term. However, this does not mean that the economy is headed for double-digit, 1970’s style stagflation. The Fed is already working to address the issue, albeit slowly. Beginning this month, the Fed will reduce the amount of bonds they purchase with the goal of ending quantitative easing in six months. This is a start. If inflation does not slow, they could always cut purchases faster to address it.
We must remember that inflation is a monetary phenomenon. It is too much money chasing too few goods. Right now, we are fighting both issues. Shortages of labor and material along with broken supply chains have reduced supply, while at the same time $8 trillion of fiscal and monetary stimulus has been dumped into the economy. The shortages should work itself out as higher prices bring out more production. It is up to the Fed to mop up the excess liquidity it has spilled into the economy to keep inflation in check. It would help if Congress would show some fiscal restraint and stop throwing gas on the fire, but we know that is unlikely regardless of who is in charge.
The million-dollar question is what changes should investors make to their portfolio? There are many calls being made to add gold, real estate, and other tangible assets to protect from inflation. The new rage is to purchase crypto currencies as the new digital gold. Some of these may make sense over the short term, but all are speculative in nature. If you don’t get the timing and direction right, it could hurt the portfolio more than help it. Not to mention, but some of those categories have their own issues with manias and current euphoric markets (I’m looking at you, crypto) which can result in unwanted volatility.
If history is any guide, long term investors will continue to be well served through a diversified portfolio and maintaining discipline, even in times of higher than normal inflation. In the 1940’s, 1970’s, and 1990’s, America saw inflation reach levels greater than where we are today. In each period, stocks suffered bouts of volatility and decline, but came out higher over time. Contrary to what many say today, bonds actually performed very well in the 1970’s as higher yields helped returns quickly recover from lower bond prices.
It may not be the sexy answer, but what often makes the most sense is to stay the course. Afterall, a good financial plan will have accounted for periods such as this.