Yesterday, when discussing the volatility of emerging market stocks, I have to admit that I was a little surprised by the year-to-date return, which is up 16.15 percent through yesterday as measured by the MSCI EAFE EM index.
That’s pretty amazing because three months ago, the index was basically flat for the year – the entire return occurred almost exclusively since the Brexit (not that they are related – I just picked it because we all remember it).
I happened to receive a report yesterday that showed about $15 billion of new money flowed into emerging market stock mutual funds and exchange traded funds (ETFs) over the past three months.
That’s a large number in the sense that it’s bigger than the largest allocation of any single pension, but still small compared to the overall value of emerging market stocks.
That may reflect macro momentum traders flowing into what’s hot, but I also couldn’t help but think that it was old fashioned performance chasing by individual and institutional investors.
I thought it would be interesting to look at some return series that Morningstar compiles that attempts to figure out the actual cost of performance chasing. They look at the return of the fund compared to the returns of the investors based on the assets under management of the fund.
In the chart below, for example, we can see that the Vanguard Emerging Markets Mutual Fund lost -1.3 percent, but their investors fared a little better, only losing -1.0 percent.
That’s positive market timing, but if you look at the longer term data, you can see that the timing was very expensive. Over the last 15 years, the fund has earned 9.8 percent, but the investors in the fund, who in the aggregate timed their buys and sells poorly, only made 4.3 percent per year.
That’s a lot per annum, but cumulatively, it’s really crippling: the difference between almost doubling and more than tripling your money.
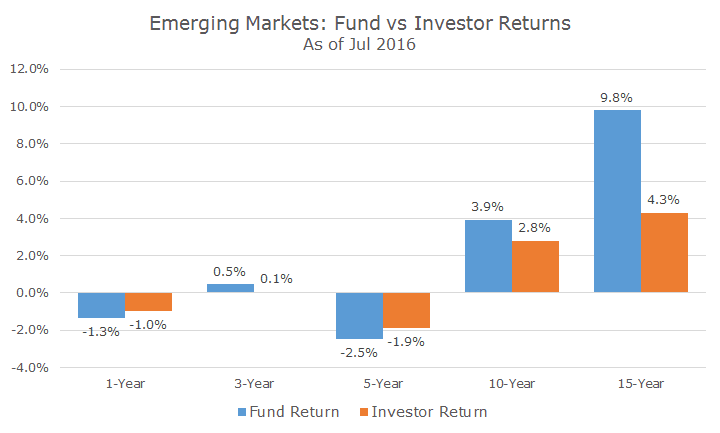
It occurred to me that the more volatile the asset class, the larger the differences might be between the fund returns and the investor returns. I pulled up the same data for the Vanguard 500 fund and the Vanguard Total Bond fund, which tracks the Barclays Aggregate bond index.
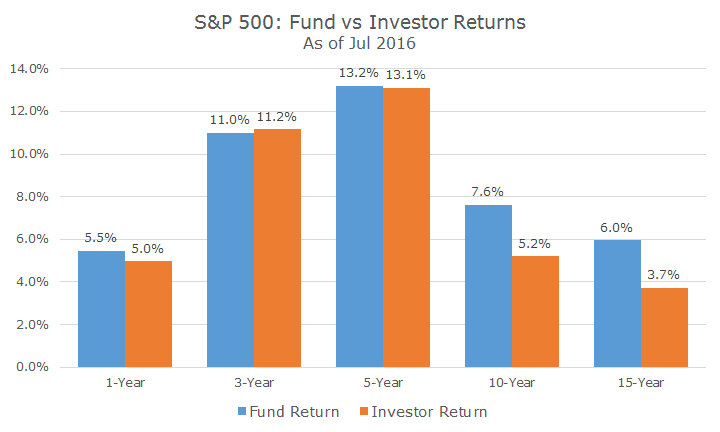
I was surprised to see that over the one, three and five year periods that the fund returns and investor returns are about the same. That is heartening, although the cynic in me thinks that it’s been easy to stay invested over the last five years given the great bull market.
That argument doesn’t hold up very well, though, because over the past year, when the differences are small, we had two distinct corrections. Maybe investors are getting better, but I have my doubts despite the chart.
Generally, though, we do see that even over the longer run periods, the differences are a lot smaller than they are in the emerging market stocks. I think that is directly related to the relative lower volatility of US stocks versus emerging markets stocks.
In the bond world, where volatility is even lower, the return differentials are even smaller. It’s still not great given the lower overall returns, but it’s better.
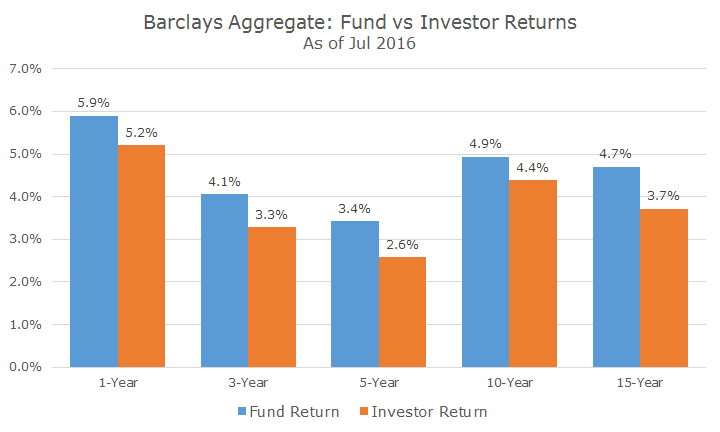
Still, I think this is evidence that lower volatility leads to smaller differences in investor behavior – it’s easy to hang on when values aren’t swinging wildly.
In my mind, this data supports the idea that investors need to hang onto their allocations through thick and thin – performance chasing is just too costly.