Yesterday, one my favorite long-time clients and Daily Insights readers emailed and asked whether we had ever looked into the old saying, ‘Sell in May and stay away!’
As it happens, I did do a write up on this topic last May, but we have a new website since then and for reasons that I don’t know, that article didn’t make it onto the new site. So, it was a perfect opportunity to revisit the old saw and get the lowdown.
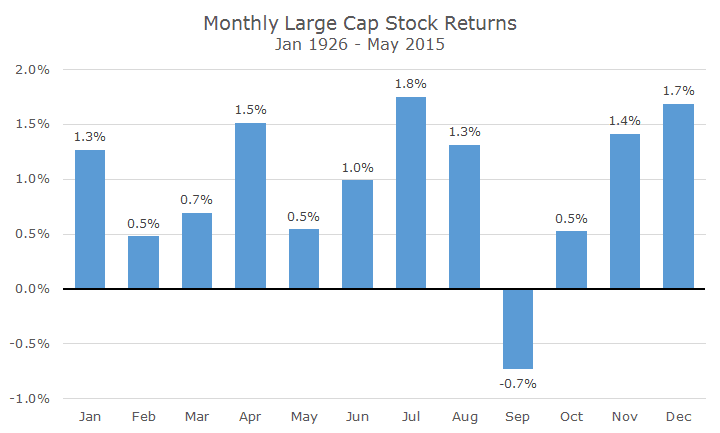
I started by looking at the average monthly return for the S&P 500 dating back to 1926. On average, all of the months are positive except for September, which I always find surprising because October is such a notoriously bad month with not one, but two Black Mondays.
Long time readers know, of course, that averages don’t tell the whole story. I just made my ‘head in the freezer’ joke yesterday, so I won’t hit you with it again right now.
To illustrate the problem of looking at averages, I calculated the average volatility for each month and created a second chart that shows some of the basic ranges you could expect each month based on historical data.
The blue columns in the second chart are identical to the ones in the first chart, they just look a lot smaller because the range of data is so much bigger.
The grey line with the larger dots represents one standard deviation away from the average, which means that you could expect monthly returns to fall within that range about two-thirds of the time.
The second gray line with finer dots does the same thing, but it’s two standard deviations, which means that most returns would fall within that range 95 percent of the time.
About five percent of the time, returns can fall outside of that range and watch out because those moves can be big! The worst month was in October 1929, when stocks fell by -29.7 percent in just one month. That makes the -16.8 percent loss we suffered in October 2008 look like child’s play. There have been good times too, though, in April 1932, the market rose 42.6 percent.
For fun, I also threw in the current year in orange bars, just to show how downright normal this year has been so far. It doesn’t feel good because the overall total return is low so far, but it’s clearly nothing out of the ordinary.
I realize that I haven’t answered the ‘Sell in May’ question and was distracted by those pesky average returns, so let me get back to the point. What would have happened if we sold in May and got back in for November, historically a good month?
Not very well, it turns out. The annualized return for a simple buy and hold for the entire period was 10.10 percent. An investor that sold in May, bought one-month Treasury bills and bought back stocks in November would have earned 8.44 percent, a loss of -1.66 percent per year.
If that doesn’t sound like much, check out the difference when you compound over 89 years: $1 invested in the buy and hold strategy would have turned into $5,415, while a dollar invested in the Sell in May strategy would be worth $1,391.
I think this actually overstates the case for the Sell in May approach because it doesn’t factor in transaction costs and, more importantly, the high tax rates on short-term capital gains. I didn’t run any numbers on this, but I promise that it would be a huge drag.
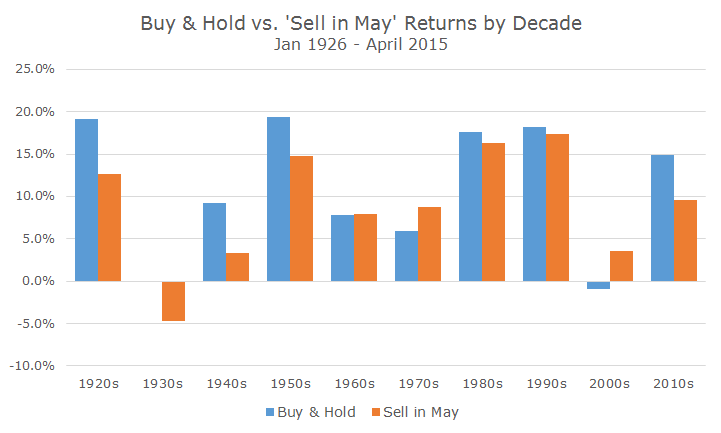
One of my other clients and loyal readers is often a little annoyed when I do very long, sweeping analysis since no one invests over an 89-year period. So, I decide to break up the two strategies into decades to see what they looked like.
Ignoring costs and taxes (which is a lot to ignore), the Sell in May approach did win during the 1970s and the 2000s (it marginally won by 0.09 percent per year in the 1960s, but I’m calling that a draw).
I have no basis in saying this, but I think that the person who made up Sell in May decades ago had a summer home up North and just wanted to take some time off for some swimming and sailing with their family.
Since the strategy doesn’t seem to have merit, I guess that I’ll be working this summer and early fall.


