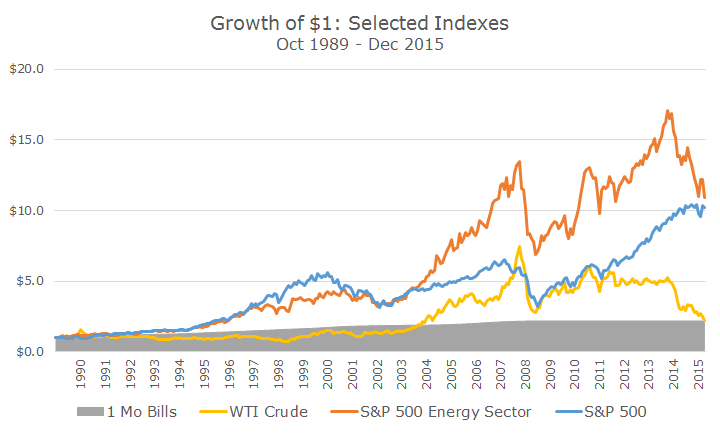
One of my favorite long-timer readers asked me today to follow up on the chart from yesterday to include the performance of energy stocks (click here to see yesterday’s chart).
The best quality sector data from S&P only dates back to 1989, so this data set isn’t quite as long as what I showed yesterday, but the story is basically the same and I have to admit that I was surprised by how well energy stocks have done over the last 25 or so years.
In fact, despite the absolute bear market in energy stocks, which have fallen by about a third since their peak last year, they are still outperforming the S&P 500 when you look at the entire period.
In that same vain, when we look at this shortened period, WTI crude has kept pace with inflation, unlike the chart yesterday that showed crude failing to keep up with inflation – it just goes to show how so much data is period specific.
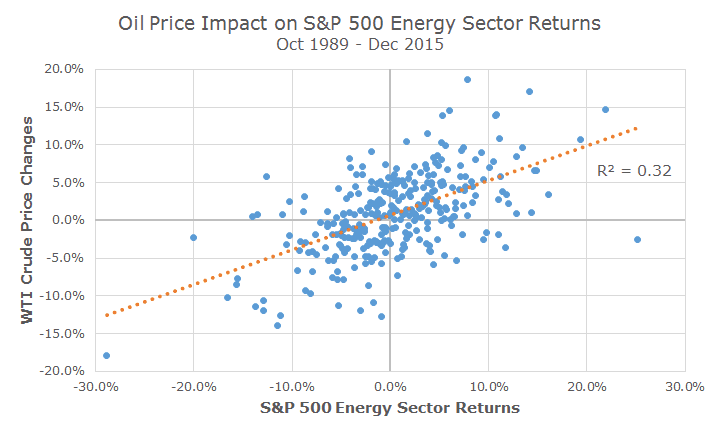
A hairy eyeball analysis of the chart clearly shows a connection between oil prices and energy stocks, so I created a scatter-plot that compares WTI crude prices to energy stocks to see how much energy prices explain energy stock returns.
A simple visual gander tells us that there is a fairly clear positive relationship between WTI crude prices and energy sector returns. In statistical terms, you can look at the R2 on the chart and say that WTI crude price changes explain 32 percent of energy sector returns – a large number, but not the whole story.
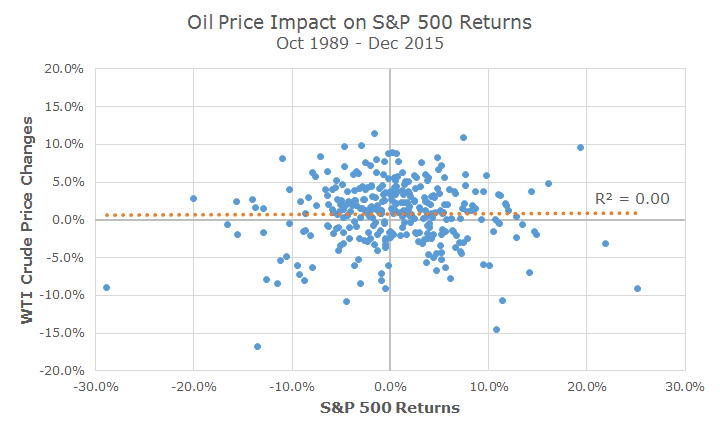
I thought it would be interesting to run the same analysis for the S&P 500 and, somewhat unsurprisingly, I found that oil doesn’t really explain any of the returns for the S&P 500 over this period as seen by the R2 of zero.
Clearly, there are periods like the last few months where stocks and oil prices are highly correlated with each other, but that hasn’t been the case for the ‘medium run.’
It’s impossible to say how long the current relationship will last – probably until oil prices settle down or a bigger story comes along – but who knows when or what that will be?


