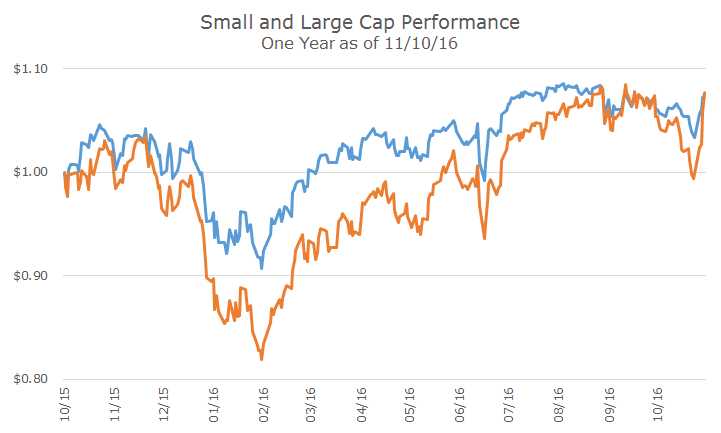
One of the interesting elements of yesterday’s trading was that small cap stocks continued to pop, jumping 1.59 percent.
I don’t have a particular explanation for this movement, but it’s significant enough that I think it’s worth mentioning and it’s an example of positive volatility. Too often we think of volatility to the downside, but the movement in small cap stocks in the past few days is a good reminder that upside surprises also happen.
I forgot to label the chart above, but the orange line reflects the price performance of the Russell 2000 index of small cap stocks and the blue line depicts the price performance of the S&P 500 index of large cap stocks.
You can see that until January, they traded similarly to each other, but when stocks were selling off in general, small cap stocks fared much worse, dropping almost 20 percent while large cap stocks were closer to 10 percent.
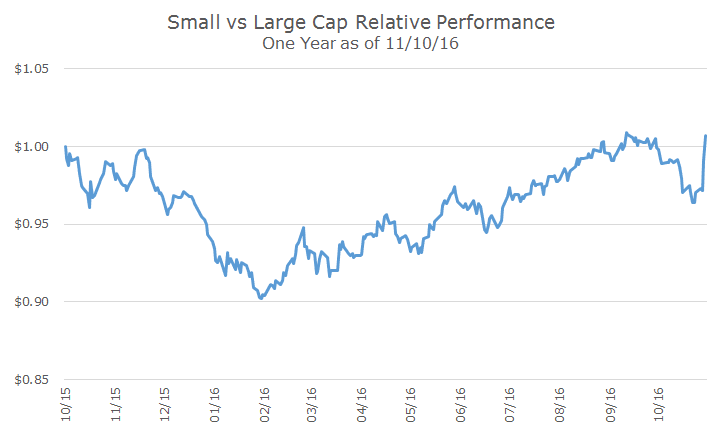
Over the last eight months, small cap stocks were slowly but surely catching up and were basically even until the middle of last month. As markets sold off again, small caps sold off more quickly, but when markets bounced back after the election, small caps bounced higher and may not have even quit yet.
The chart above shows the same thing, but just looks at the difference in performance between the two. This visual takes out the overall market results and isolates the difference between the two, which highlights the relationship in my opinion.
Whether or not the outperformance reflects a change in investor attitudes (risk-on versus risk-off, as I mentioned yesterday) is an open question.
Academics would probably be able to show that there is no signal here that means anything and they are probably right. Still, as long as you don’t try and trade this kind of thing, there’s nothing wrong with this kind of eye candy.


