Cathy Woods is a fascinating character. Her ARKK funds were the darlings of the pandemic, focused on innovation, and were on fire. Not surprisingly, investors poured money into the funds, just in time for them to collapse.
The fact that investors piled in and out isn’t Woods fault. She bought a portfolio of stocks that she believed in and stuck to her style through the boom and the bust.
Last week, I was looking at one of my favorite websites that is chock full of tools for quantitatively analyzing mutual funds and ETFs. I looked at Woods’ flagship fund, the ARKK Innovation fund (ARKK), and saw that it has annualized alpha of 9.5 percent with a t-statistic of 2.09!
I know that some of you readers just fainted in amazement, like I did when I first saw it, but the other 99.9 percent of you are wondering: what the heck is Dave talking about?
Alpha is one of the most widely misunderstood data points in all of investing. I hear industry professionals misuse the term all the time and it took me a while to understand it. I haven’t written about it because I think it may be too technical and boring.
But then the Cathy Woods data was just so amazing that I had to cover it, and there’s an important lesson in her results about alpha.
So, let me start with a simple statement: alpha is a return that isn’t explained by beta; and since it’s not explained by beta, it’s often attributed to skill. Helpful, right? just kidding, I know that didn’t help anything since nobody really knows what beta is either.
Beta is a measure or risk that looks at two things: the relative volatility of two investments and the correlation between them.
Let’s calculate the simple beta for ARKK for the last five years using monthly data. The volatility of her fund is 12.0 percent, and the volatility of the S&P 500 is 5.4 percent). So, the relative volatility is 2.22, (12.0 / 5.4).
Then, we take the relative volatility of 2.22 and multiply it by the correlation. In this case, the correlation was 0.74, so we take 2.22 * 0.74 and get 1.63, which is the beta.
What does the beta tell us? Well, over the past five years, if the stock market rose by 1.0 percent, ARKK rose by 1.63 percent. And, if the market fell by -1.0 percent, ARKK fell by -1.63 percent.
And, as always, that’s on average and over time. Beta is a rough proxy for risk and told you that ARKK was about 60 percent more volatile than the market.
Now, here’s where the alpha comes in. Some of the performance of ARKK over the last five years isn’t just a function of what the market did, or the beta. The unexplained portion is called the alpha, which in this case (for this fund, for this period, for this model) is -1.0 percent per year.
But that doesn’t jibe with what I said above about 9.5 percent alpha per year. And that’s what makes alpha confusing: it depends on the model that you use to calculate it. In my simple example, I only considered one factor, the market.
In reality, we use multiple factors in models like this, and the factors should sound familiar: size, value, momentum, and quality. Those four factors, plus the market, create a five-factor model that allow us to better understand the source of returns.
For most funds, those factors do an awesome job of explaining the returns. If I use this five-factor model to evaluate the Vanguard Total US Market ETF (VTI), the model explains 99 percent of the returns and there is no alpha.
But (and this is the part that will make you fall off your chair) when you look at ARKK, the model explains 81 percent of the returns and has a statistically significant alpha of 9.5 percent per year.
Let’s look at a picture to see if that helps get the point across. The following chart stacks the cumulative returns of each factor for the ARKK fund and for the Vanguard Market ETF.
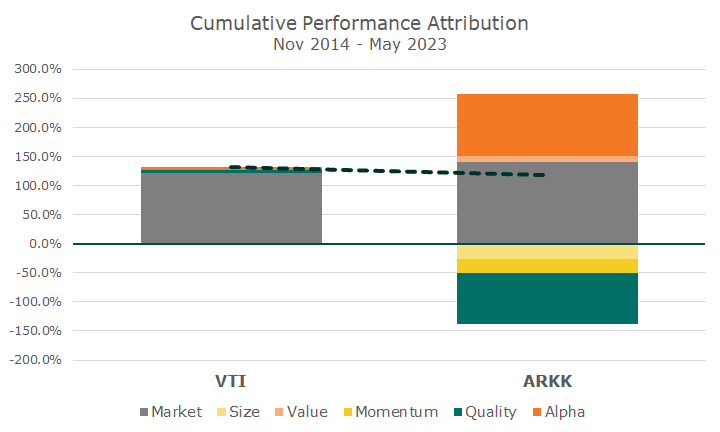
The left stack represents the different sources of return for the Vanguard Total Market fund, and you can see that the market factor pretty much explains everything.
The dotted line is the return that investors received and while you can see a hint of a few other colors, or factors, they don’t add up to much. And that’s just what Vanguard is offering: market exposure, very inexpensively. Perfect!
The right-hand stack shows the different factor returns for the ARKK fund, and you can see that several were positive, but a bunch were negative. The one that prompted me to write this article is the big orange alpha on top. These are cumulative numbers, and the alpha adds up to 106.8 percent. That’s amazing.
But here’s where it gets interesting. As noted above, there are several negative numbers. In this period, we know that the quality factor did very well, but Woods bought such low-quality stocks that it cost her -87 percent cumulatively. She had a lot of negative momentum too, but that only cost her -10.0 percent.
When you add up the factor results, you get 118.5 percent for ARKK and 131.9 percent for VTI. So, all of her alpha was eaten up by bad bets that went against her.
And that’s the particular lesson of the ARKK experience: just having alpha isn’t enough. We saw from the beta that the fund is risky, but we also saw that it’s betting against things that we want like positive exposure to quality stocks and positive momentum.
The alpha is amazing, but the end result isn’t, which is why you have to know what you mean when you say you want a lot of alpha.

David is a trusted advisor to 50 families, delivering comprehensive financial solutions, including financial planning, investment management, cash management, tax planning, estate planning, and charitable giving. As Chief Investment Officer, he leads the Investment Committee and the research and trading team. His team continuously evaluates investment strategies and securities, working closely with Portfolio Managers to implement them effectively.