Next Monday night, January 27th, Acropolis will hold our 7th Annual Investor Social. Although we are near capacity, there are some spots, so if you can make it, please call to make a reservation.
This week and next, I will include some slides that didn’t make it into the final presentation to keep the event moving but were too good to throw away.
I’ve often written here that stocks are expensive, and I will also address this in the presentation. These slides were created to show how stocks get expensive.
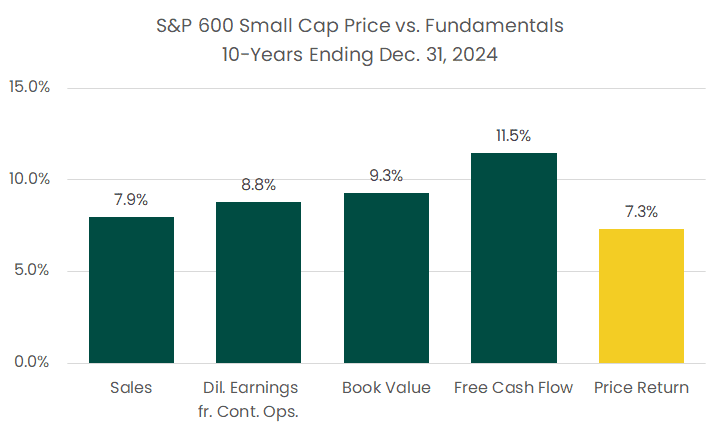
The first slide shows the growth rate of four fundamental metrics for the S&P 600 small-cap index. For the 10 years ending in 2024, sales for the S&P 600 grew by 7.9 percent, diluted earnings from continuing operations rose by 8.8 percent, the book value (assets minus liabilities) grew by 9.3 percent, and free cash flow grew by 11.5 percent.
You might think the S&P 600 price might have grown as much as the fundamentals, but the yellow bar on the right shows that the price return was only 7.3 percent. The total return was 8.9 percent, including the dividends, but comparing the fundamentals to the market value makes more sense.

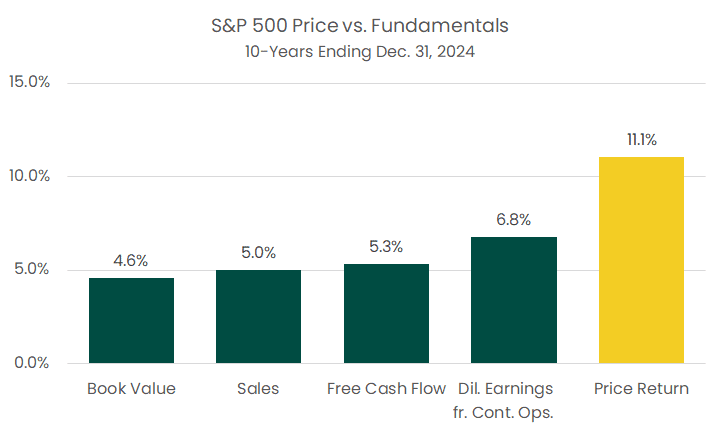
The results of the S&P 600 small cap index contrast starkly with those of its big brother, the S&P 500.
Here the fundamentals only grew between 4.6 and 6.8 percent per year – the best fundamental growth rate of the S&P 500 was less than the worst fundamental growth rate of the small cap 600.
But, as we all know, the S&P 600 has fared a lot better than the small cap, 600, which you can see by looking at the far-right column.

Two points are worth noting. First, the mismatch may be because small caps were expensive ten years ago, and large caps were cheap. That wasn’t the case!
Second, and this is the big point: investors and markets don’t look backward at what fundamentals have done – they look forward based on what they think will happen.
Right now, the S&P 500’s price movement is driven by excitement over artificial intelligence, which is driving prices higher—not just AI but technology in general.
The tech sector is only 10.6 percent of the small-cap index and a whopping 30.9 percent of the S&P 500. And the S&P 500 doesn’t classify stocks the way you and I might.
For example, I would classify Meta and Tesla as tech stocks. The index-makers call them communications and consumer discretionary (there are other good examples, but I can’t list them for compliance reasons since they are on our Approved List).
The question is whether or not tech companies can capitalize on AI and other new technologies and turn hope into profit. If companies can’t figure out how to profit from AI, then prices will sink and look more like the fundamentals.
If, for example, AI doesn’t turn into more sales, the mismatch between the five percent sales growth and the 11.1 percent price appreciation over the last ten years will converge (and not with higher sales, with lower prices).
I am skeptical that companies will be able to live up to the current hype, but I can’t say what will happen in the future. Still, I think we will look back on this the way we look back on the late 1990s. The internet is useful and people make a ton of money on it, but the prices go ahead of themselves back then.
I’ve said in defense of the market valuation that today’s tech companies make a ton of money compared to the dot-com darlings, but the second chart also makes me realize that the prices have probably out-stripped the fundamentals by more than what the future growth can achieve.
We’ll see!


