As noted above, the big story last week was about the on-again-off-again trade deal between the US and China. It’s impossible to know where the deal goes from here, but the options are basically as follows:
- Talks Continue. The negotiation deadline could be extended as it was before with tariffs frozen and additional sanctions possible. The status quo should be stabilizing for markets for a while, despite the policy uncertainty. If the tariffs raise prices for regular goods substantially and in the short-term, it could create difficulty for consumers that would affect earnings and, therefore, stocks.
- A Deal. The consensus view is that a deal could take two paths. In the first path, there is a grand compromise on general trade and technology, in which all tariffs would be rolled back and the USA-China relationship improves, which provides stability around the globe.
The second path isn’t quite as rosy, but is still pretty good: there is a deal on general trade, but not on technology. In this case, the tariffs are partially rolled back and there is a short-term improvement in the USA-China relationship that would also provide stability, but for a less extended period. - No Deal. Like the ‘deal’ option, the consensus view seems to consider two potential paths. The first path is that there is no deal and a minor escalation. The second no-deal option is a major escalation, tariffs increase, there are possible sanctions and trade instability globally. Of course, the question between these two paths is the degree of escalation, which is impossible to predict.
Unfortunately, there is not much we can do but wait and see what happens. In the meantime, I thought it would be interesting to look at the trade relationships of both the US and China, and found the following data on Bloomberg.
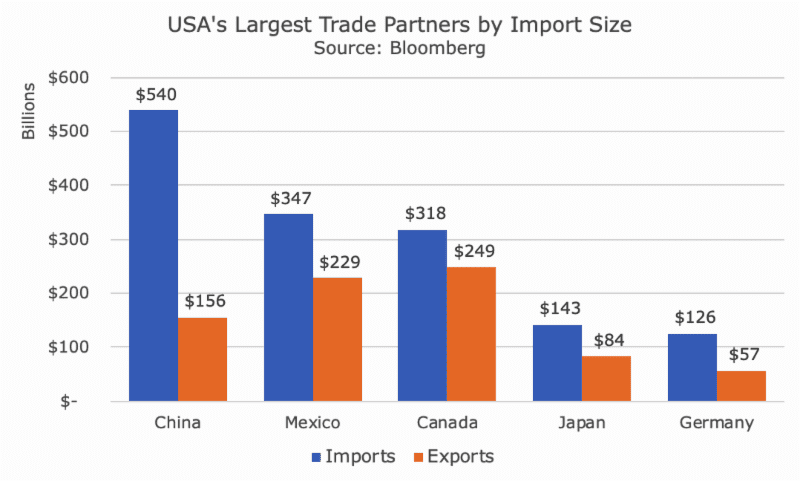
This chart shows the largest US trading partners by the size of the imports and you can see that China is by far the largest relationship – 55 percent larger than our second largest trading partner, Mexico.
You can see that we do export a little bit to China, but about 70 percent less than what we import. And, you can see that we have a deficit with all of our trading partners, but the scale is smaller.
One minor note is that we export more to Great Britain and S. Korea than we do to Germany, but this chart is organized by imports, so I didn’t include them.
The following chart is the same thing, but from China’s point of view:

As you might expect, China imports more from S. Korea and Japan than it does from the USA, so this chart looks a little funny. Notice that the numbers for the USA match those above, but the colors have switched since what is an import to the to USA is an export for China.
Just as the US chart above didn’t include the UK or S. Korea, the China chart doesn’t include Hong Kong, who is the second largest export recipient for mainland Chinese goods. They buy $281 billion worth of goods, compared to $540 for the USA and $175 or Japan. But, since China doesn’t import much from Hong Kong, Hong Kong wasn’t on the ‘top five’ list. Since Hong Kong is now part of China, it seems odd to me that they segregate this data.
Hopefully, this data illuminates the situation with China, even though it doesn’t bring us any closer to being able to figure out where the deal goes from here.