Although oil ultimately finished higher yesterday, West Texas Intermediate (WTI) crude touched on a 2004 low during the day. I know I am repeating myself, but I continue to be surprised by how far oil has dropped in the last 18 months.
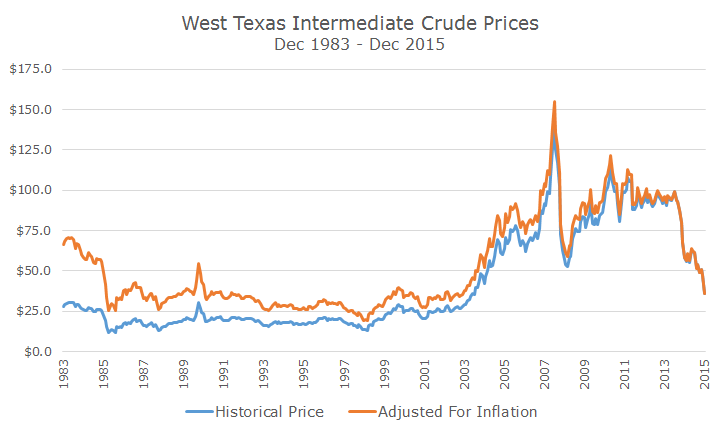
As you know, I think a chart is worth 1,000 words, so I’ve plotted the spot price for WTI as far back as my Bloomberg data would take me. The blue line shows the actual price of WTI, which hovered around $25 per barrel until 2003 when it dramatically moved higher.
The orange line takes the historical prices and puts them into today’s dollars so you don’t have to do any mental gymnastics to compare prices today to the past. I find it remarkable that oil was trading at the equivalent of $65 per barrel when the data first started compared to the $35 level today.
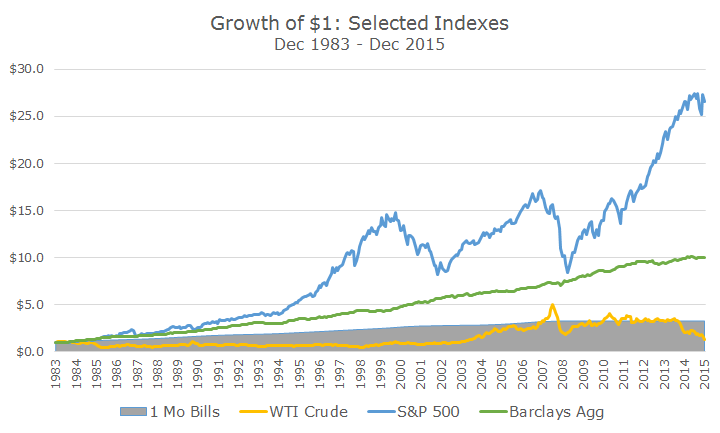
Although we considered commodities in 2007-2008 and thankfully dodged that bullet, we never would have bought just oil. But even still, I thought it would be interesting to show that oil simply wasn’t a buy and hold investment, as the chart below clearly shows.
Even if you could buy spot oil (which you can’t unless you have spare tankers sitting around), $1 invested in WTI crude would be worth less than an investment in one-month Treasury bills, which have been yielding nothing for the past six or seven years.
I don’t really follow commodity markets closely, but I do hear commentators on the radio debating whether it will bounce back sharply or stay in the doldrums in the coming years. I don’t have an opinion, but it’s clear from both charts that oil can stay low for a long time.
That doesn’t mean it won’t be volatile though. Even though the annualized return on spot oil (and again, your returns would be less because you would have to access oil through the futures markets) was a paltry 0.75 percent per year (while one month Treasury bills were 3.77 percent), prices are volatile.
The annualized standard deviation of monthly returns for WTI spot was 25.21 percent. To put that in perspective, it was 16.86 percent for the S&P 500 during the same period, which include the tech bubble/burst and the 2008 financial crisis.
That’s right, oil was 50 percent more volatile than stocks, but it yielded lower returns than Treasury bills over a 32 year period.
When we decided against commodities (a very popular idea back then), we concluded that it had low correlation properties, which is good, but at the expense of bond-like returns and stock-like volatility – an unfavorable combination.
We didn’t know that things would get this bad for commodities or oil, but I surely am thankful that we avoided them.


