As we approach the halfway point of 2018, some things are looking very different from last year. Although it has been a bumpier ride compared to last year, US stocks are on track to have another good year as the S&P 500 is up more than 4.5 percent and the Russell 2000 Index is up more than 10 percent. But unlike last year, international stocks have effectively been flat, flipping between small gains and losses for most of the year.
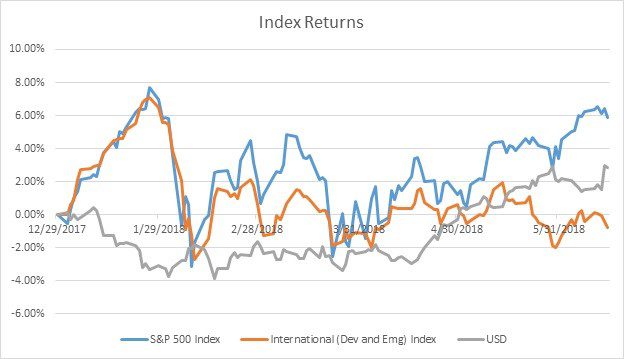
Given international’s drastically different performance from 2017, I thought it would be worthwhile to break down the international performance, to see whether it is the currency or equity that has been driving returns.
To do this, I looked at the iShares MSCI All World Index ex USA ETF. This ETF tracks the MSCI ACWI ex USA Net Total Return Index, which is very similar to the international performance we quote in the table above. The analysis looks at the full year for 2017 and the first half of the year for 2018, so this isn’t exactly an apples to apples comparison, but it still provides a pretty clear picture of what’s going on.
The first aspect to look at is the country weights. To do this, I looked at the top 15 holdings to see if there were any outliers.
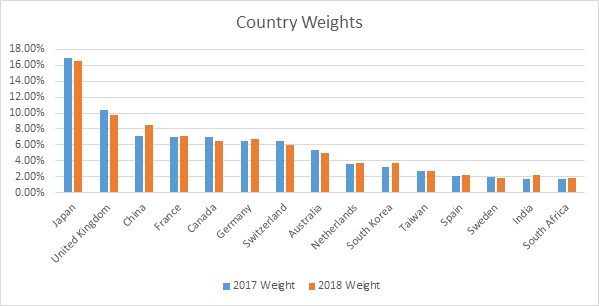
As we can see, the weights were pretty consistent with some slight differences. The index maintains the heaviest weights to Japan, UK, and China, which is consistent with the size of their markets.
Next, I looked the country returns of the top 15 holdings in their local currency. To do this, I used the MSCI Local returns for each country. These returns represent a much more diversified return than what is actually held in the index, but it still provides a good idea of the individual returns.
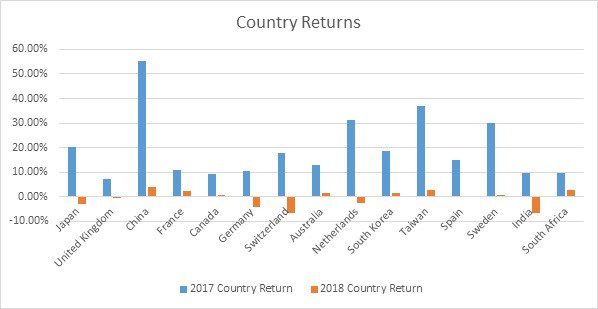
Here, we can clearly see that country performance year-to-date is significantly lower this year than last year, but the returns between countries are mixed between positive and negative. Using a portfolio analytics function in Bloomberg, I found that year-to-date, the equity portion of returns in local currency had a positive effect on the portfolio.
The other primary aspect of returns is the currency effect. Since we are US investors, foreign returns will have to be converted back to US dollars.
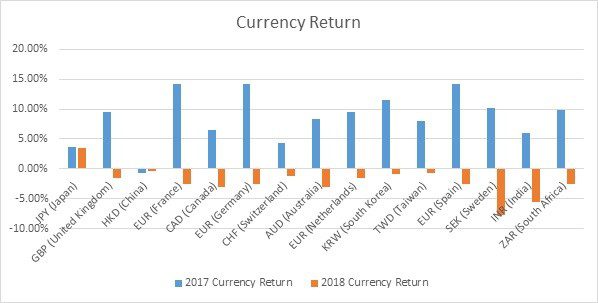
Looking at the chart, we can see that with the exception of Japan, all currencies have depreciated (loss) against the US dollar this year, whereas last year most currencies appreciated (gain) against the US dollar. Not surprisingly, the Bloomberg analytics tool calculated a negative return contribution for the portfolio, so much so that it pulls the whole index negative for the year.
While each country has its individual drivers of performance, there are a few major factors that have been driving lower equity returns as well as lower currency returns.
The first is the volatility crash that drove global markets (including the US) lower in late January. The second is concerns over trade wars, which started in late February. The trade war concerns hit both the US and global markets, but it has seemingly impacted global markets a little harder as they have not recovered as well as the US has. Both the volatility crash and trade war concerns have primarily affected equity returns more, which is why the local international equity returns are mostly flat with a slight positive tilt.
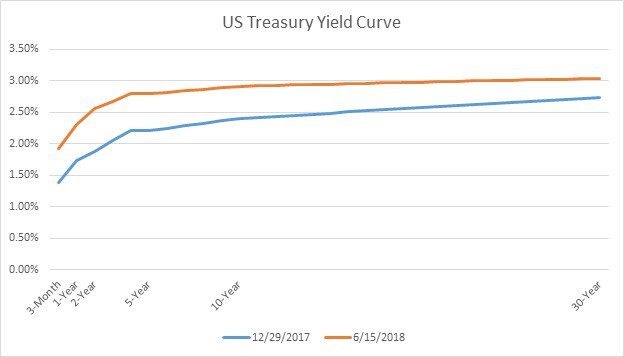
The other major factor is the rising dollar as the Fed raises rates. This has caused the dollar to appreciate relative to other currencies, which makes it more expensive for emerging markets to borrow and more expensive for US investors to transfer returns back to the US. Looking at the yield curve change since the beginning of the year, we can see how rates have moved up, which has helped contribute to the rising dollar.
Obviously, nothing is certain or guaranteed. The Fed is anticipating more rate hikes and President Trump is moving forward with his tariffs. But we also believe in efficient markets, so most of these effects are already priced in and we could see something drastically different in the second half of the year. In the meantime, we’ll continue to see the benefits of the only “free” lunch: diversification.