Although there was no specific catalyst for yesterday’s trading action, investors are clearly worried about global growth. The chart below shows the most recent Forecasts from the International Monetary Fund (IMF) that were produced in July.
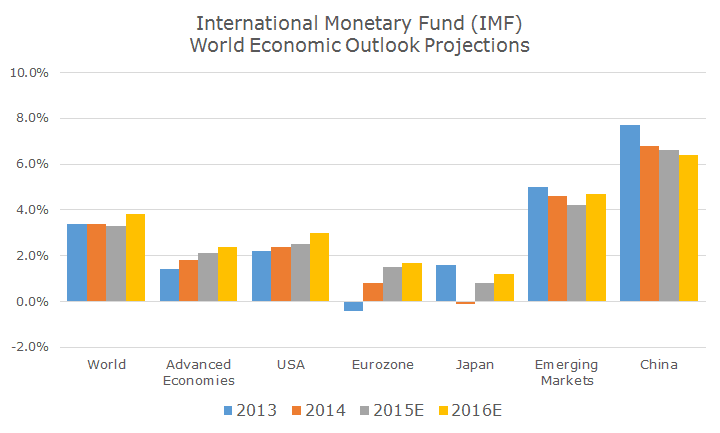
While the global growth picture is flat and advanced economies are growing, according to their projections, emerging markets and China are slowing down. This isn’t news: the market volatility that we’ve been dealing with over the last month is essentially the market repricing even lower estimates for emerging and China growth.
Since last Thursday when the Fed opted to keep interest rates unchanged and citing global concerns (read China), I believe that markets have been repricing growth estimates in the US. It’s impossible to know what markets are really doing, but this is as good a guess as any.
Just like the fed funds target rate dot plots that we looked at last week, the Fed releases economic forecasts from the various FOMC members.
The following chart shows their estimates for real (inflation-adjusted) GDP growth for 2015-2017 and an estimate for ‘longer run’ growth.
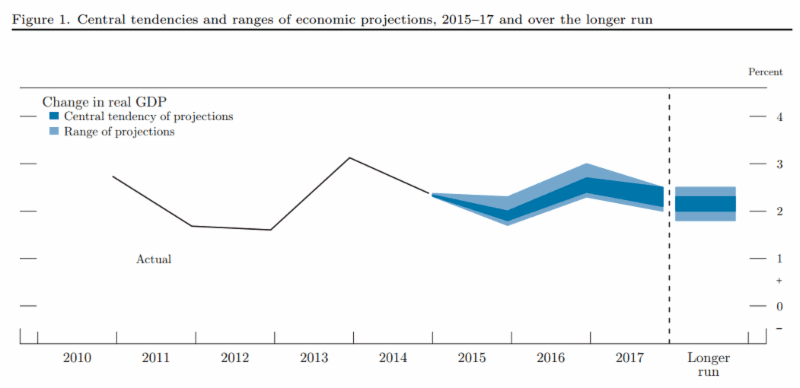
Since I think short term forecasts are somewhat dubious (so why do I look at them all the time? It’s a good question and I don’t have a great answer), I focus my attention on the longer run numbers. In the July forecast, the central tendency was just above two percent.
The Fed defines longer run as something around five or six years, barring any shocks to the system and under what they call ‘appropriate monetary policy.’ (More details can be found on their Frequently Asked Questions page, found here.)
The most recent economic projections from the Fed show a slightly less optimistic picture. The central tendency is now lower, partly above and partly below two percent.
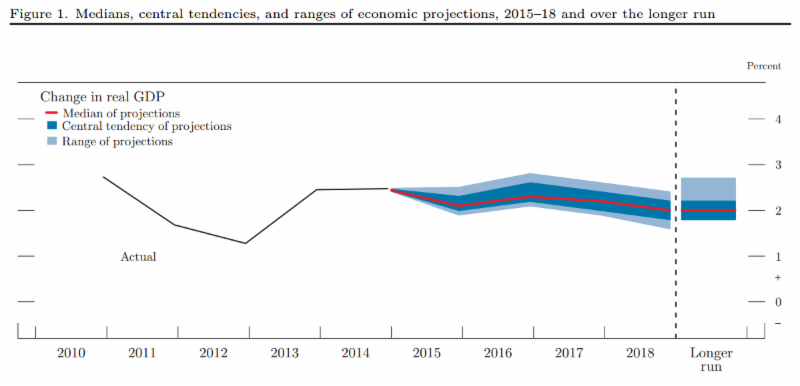
While the range is unchanged to the downside, there are a few more optimistic members that increase the top end a little bit. There’s a new piece of data: the median, which is in red and is right at two percent.
What bothers investors, in my opinion, is that the estimates are lower, but also that the Fed tends to be optimistic in their forecasts, so it’s natural to wonder what their ‘real’ estimates are at this point.
The problem for the Fed is that their projections can be self-fulfilling prophecies. If they slashed their estimates dramatically, financial markets would sell off even more dramatically, everyone would get nervous, businesses and consumers would pull back and growth would probably be lower than it would have if they said nothing. Hence the optimism.
Even though the lower growth forecast does bear noting, it’s also useful to recognize that the current market volatility is perfectly normal – even though we were down a lot yesterday in the middle of the day, it’s not like it was this time a month ago.
The easiest way to see that is by looking at the CBOE Volatility Index (VIX), which shows that expected volatility is trending down instead of spiking like it did last month. At this point, we’re nearly where started the year and not too far from the average this year (the dotted blue line).
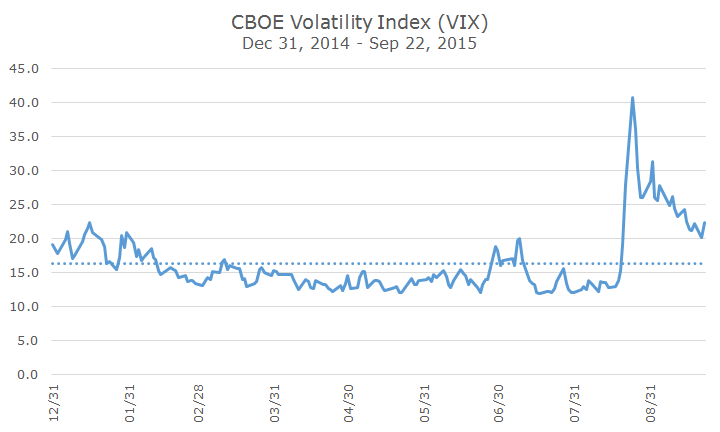
If I put the longer-term average on the chart, it would be at 20, so what we’re experiencing right now is normal, not the low volatility spring and summer that we enjoyed.