As noted above, the March Consumer Price Index (CPI) inflation data exceeded expectations.
The year-over-year headline rate was expected to be 3.4 percent but was actually 3.5 percent. The core rate, which excludes food and energy, was expected to be 3.7 percent but was 3.8 percent.
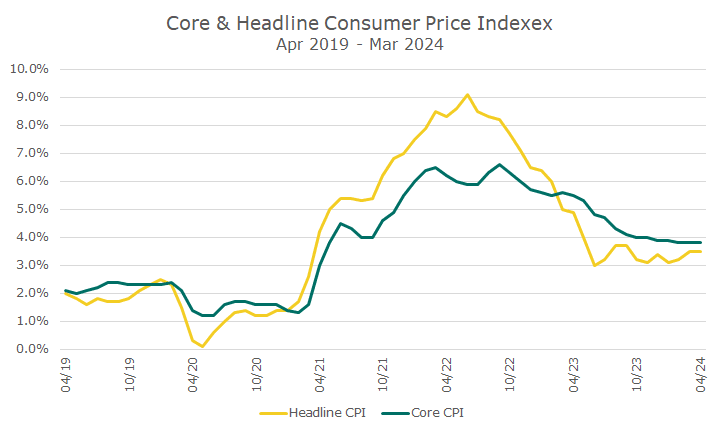
Those might not sound like big misses at one-tenth of one percent, but the chart below helps tell the story.
The chart shows the past five years of headline and core inflation. While both indexes have fallen meaningfully from their highest in 2022, progress toward ‘normal’ inflation has slowed to nearly a halt in the last six months.
Particularly concerning is the core inflation data, which is actually higher than the headline rate right now.
Although I’m not showing it on the chart, there is another measure that was popularized in the last year or two, called ‘super-core’ inflation.
Supercore inflation excluded housing inflation in addition to the usual food and energy inflation. The idea was that housing data is difficult to compute in this index, and the data is so lagged, that we weren’t seeing the ‘progress’ of lower inflation because housing data wasn’t accurate or up-to-date.
I haven’t spilled any digital ink on the matter before because I felt like slicing and dicing the data too finely isn’t useful and lends itself to manipulation. I do pay attention to the regular core rate in addition to the headline rate.
I mention the supercore rate today because it’s actually headed higher, which means that the high inflation reading isn’t about food, energy, or housing. The inflation we have today is due to stickiness in service prices.
Services are things like transportation, recreation, and medical care, and stand in contrast to goods, like cars, clothing, or anything that could get caught up in the pandemic related supply chain problem.
Inflation related to goods has come down now that the supply chains are basically back to normal, but the services inflation is hanging around, which means that the Federal Reserve will likely keep rates higher-for-longer.
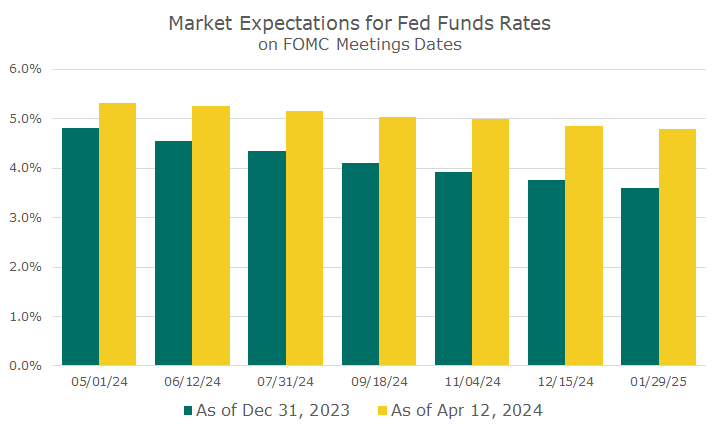
The chart below shows the market expectations for Fed Funds, based on futures prices.
The green bars represent the market expectations at the end of last year for each of the Fed meeting dates this year (and one in 2025). You can see that markets were pricing in a fairly substantial decline, which boosted stocks and bonds in the fourth quarter.
The yellow bars show the expectations for each meeting as of last Friday, and you cans see that while there is some expectation of lower rates, it’s not nearly as dramatic as before.
Markets were downright euphoric in the fourth quarter of last year when the Federal Reserve signaled that they might be on the cusp of cutting rates.
That momentum largely carried over into the new year, with eye-popping returns in the first quarter. And, even though markets were down for the past two weeks, it’s important to put it into perspective: the S&P 500 is only down -2.5 percent from the high last month and is still up 7.9 percent for the year.
We also now have an escalation in the Middle East crisis with the Iranian missile attack on Israel, which happened after the market closed on Friday.
While it’s impossible to predict what will happen, it wouldn’t be surprising if risk appetite falls and investors sell stocks and buy Treasury bills or notes.
As much as I don’t like seeing my account balance fall, I also think it’s appropriate to expect some decline given how strong markets have been despite the uncertainty about inflation and interest rates, not to mention the ongoing geopolitical risks.
I suspect we’ve done our job appropriately by finding an asset allocation that meets our client’s risk tolerance. After all, we’ve done this through the tech bubble burst, the 2008 financial crisis, and the pandemic, to name a few.
Each event was unexpected, and although the 2008 financial crisis was a strenuous test, very few clients exited markets and had their money invested for the market recovery that followed.

David is a trusted advisor to 50 families, delivering comprehensive financial solutions, including financial planning, investment management, cash management, tax planning, estate planning, and charitable giving. As Chief Investment Officer, he leads the Investment Committee and the research and trading team. His team continuously evaluates investment strategies and securities, working closely with Portfolio Managers to implement them effectively.