Some kinds of diversification are better than others. Legendary investor Peter Lynch often referred to corporate ‘deworseification’ back in the conglomerate days when companies like ITT owned businesses as varied as hotels, insurance, defense contracting and for-profit education.
One kind of diversification that Morningstar has popularized, but that I don’t think is particularly useful, is diversification by style box. As you can see in the image, Morningstar has cut the market across two dimensions in nine categories.
The first dimension, from top to bottom, slices the stocks by market capitalization, or the size of a company. Big companies like General Electric, Pfizer and Verizon fit in one of the top three boxes.
The second dimension, from left to right, is meant to describe whether a stock is growth or value.
These definitions are notoriously squishy, but, at Morningstar, value stocks are considered cheap based on traditional measures like the price-to-earnings ratio, price-to-book, the dividend yield, etc.
They determine what stocks are growth stocks based on long-term projected earnings growth, sales growth, cash flow growth, etc. The details of their scoring method can be found by clicking here.
Since a stock mutual fund or ETF is nothing more than a pool of individual stocks, Morningstar looks at the fund’s underlying holdings and rolls them up into one big score to determine whether a fund is growth, value or blend (which effectively means ‘in-between’). Roughly one-third of each market cap segment is split into either growth, value or blend.
On the one hand, I like the idea of simplifying the market across the classic two dimensions that Gene Fama and Ken French developed in the 1990s, but this implementation is quite different than what they intended (although to conserve space, I’m going to save that argument for a different day).
Many investors that are familiar with the Morningstar style box feel that it’s important, for diversification reasons, to split the money across all nine boxes. When we first got going 12 years ago, we did something similar, although we had a 2:1 ratio of value to growth weight.
It’s very common to see investors weight evenly between value and growth, whether its 50/50 growth/value or a 33/34/33 growth/blend/value split across large cap. This is the part that I don’t think gets you any meaningful diversification. A strategy like this isn’t terrible, but I’m not sure what the benefit is either.
Whether you do a 50/50 or 33/34/33 split of growth and value does nothing to reduce the risk of your portfolio compared to just owning the S&P 500.
Imagine that you own the S&P 500, which means that you have exposure to 500 stocks and your largest holding is 3.81 percent of the index.
That same stock (I can’t name names because it’s on our Approved List), is 7.32 percent of the growth index. That’s a lot, but it doesn’t even register in the top 25 of the value index, so if you have a 50/50 growth/value combination, your exposure is 3.66 percent (7.32 percent divided by two).
That should seem familiar because, remember, it was 3.81 percent for just the straight S&P 500 and 3.66 and 3.81 are pretty darn close. If you pursue the 33/34/33 strategy, then your exposure is 3.71 percent, a mere 10 basis points different than just owning the S&P 500 index without a growth or value tilt.
Although I used the largest single stock in that example, I ran it out to 25 in my research. The weights vary a little bit, but not enough to alter performance.
In addition to looking at current holdings, I decided to just look at the performance of the S&P growth and value indexes since they were created in 1994.
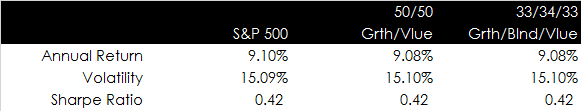
As you can see, the results are basically identical. The differences that you see are basically noise and would be impossible to tell apart statistically.
These results assume that there were no costs, which is a foolhardy assumption in the real world. The growth and value index fund have a 0.09 percent expense ratio for Vanguard ETFs, compared to 0.05 percent for the S&P 500 fund. It’s true that the number is small, but what are you paying for?
The point here is that you have to think about what you are trying to achieve when you make these kinds of decisions. If the idea is diversification, I don’t think you’re getting what you want from this kind of strategy.
Like I said above, a strategy like this doesn’t hurt you, but it doesn’t do much to help you either.