Five years ago, dire predictions were a dime a dozen. It was, after all, a very scary time fraught with uncertainty.
Amid all of the dreadful forecasts, one bothered me a lot less than the others: the US dollar would collapse leaving Americans pushing around wheelbarrows of worthless cash in order to buy just one loaf of bread like in Germany’s Weimar Republic.
The idea was that the Federal Reserve was going to print too much money in response to the financial crisis and generate uncontrollable inflation, which would hurt the value of the dollar.
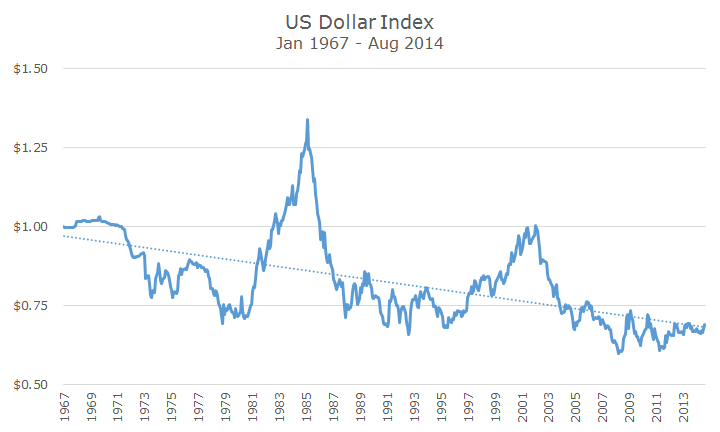
Since the end of 2008, the value of the US dollar, as measured by the US Dollar Index, is actually up two percent – basically unchanged. The following chart shows the history of the index starting in 1967.
The dollar index was first created by the Federal Reserve in the early 1970s (it was backdated to 1967) to provide a method for estimating our purchasing power with our trading partners; the basket of currencies used to compute the value of the dollar changes as our trading partners and patterns shift.
Like most major world currencies, the dollar was explicitly tied to the price of gold and that system ended in 1971 when President Richard Nixon took us off the gold standard and currency prices became free-floating.
The initial decline on the chart through the early 1980s was essentially a medium-term unwinding of the fixed system, which probably overstated the value of the dollar at the expense of Germany and Japan, our enemies in World War II (when Bretton Woods was formed) and fierce competitors in the 1970s.
At the same time, our burgeoning fiscal problems, weaker trade position and inflation were incorporated in the price of our currency.
To curb inflation, the Federal Reserve Chairman dramatically raised interest rates, which subsequently caused the dollar to rise sharply between 1980 and 1985 as global investors sold their own bonds in favor of US Treasury bonds with higher yields.
The strong dollar actually hurt America’s competitiveness by making our products expensive overseas, so in 1985, central bankers from around the world agreed to lower the value of the US dollar in an agreement known as the Plaza Accord.
The dollar enjoyed another period of high prices during the late 1990s as we got our fiscal house in order (however briefly) and investment capital was again flooding into US markets in hopes of profiting from the internet related technology boom (bubble).
A lighthearted guide to whether the dollar is over or under-valued now is something called The Big Mac Index, created by The Economist. The basic idea is that a Big Mac ought to cost the same whether you’re in St. Louis or Saudi Arabia.
In the US, a Big Mac costs $4.80, on average. In Norway, a Big Mac costs 48 Kroner, which is the equivalent of $7.76 based on today’s exchange rate, suggesting that the Kroner is 60 percent overvalued.
At the other end of the spectrum, you can buy a Big Mac in the Ukraine (maybe not the Eastern part) for 19 Hryvnia, or $1.63, suggesting that the Ukrainian Hryvnia is undervalued by about 65 percent.
Obviously, this is a little on the silly side (click here for more folly with a complete Big Mac calculator, although a subscription may be required), but you get the idea.
In the end, I don’t worry too much about a falling dollar, especially if it happens slowly, like it has over the past 40+ years. A falling dollar helps keep US products and services competitively priced overseas and serves as a nice tailwind for our non-US stock exposure.
There are things to worry about (and there always will be), but the ‘coming dollar collapse’ or ‘impending dollar debasement’ ought to be low on your list.


