The new 2018 tax laws are already having a major impact on investment portfolios. Lower tax rates, especially the decline in corporate rates, has boosted optimism for economic growth and higher wages which has manifested itself in higher stock multiples and higher prices. The opposite has happened with interest rates. Higher growth and wages would be expected to bring higher inflation too. Increased inflation expectations along with an expectation for a hefty increase in Treasury supply to fund higher deficits have resulted in long term interest rates rising rather quickly.
All of these market effects are indirectly tied to tax reform. However, municipal bond portfolios are directly impacted by lower taxes. Corporations that own tax exempt bonds in their portfolio will find that book yields have declined as the value of the tax exemption is now worth less. Traditional muni buyers may now find that higher after tax returns can be found in taxable bonds. As tax rates decline, so does the taxable equivalent yield of a muni bond.
In most markets, we would expect a change in the realized value of a bond to result in an overall change in price to compensate investors for the loss of the tax advantage. We would expect investor demand to fall until nominal rates increased to the point where the taxable equivalent yield was the same as before. Over time, we would expect lower tax rates to result in higher muni yields.
However, this tax cut is different because it effects corporate income much different than personal income. Over half of the muni market is held in retail accounts (via bonds and mutual funds) with the other two major holders being banks and insurance companies. The top rate for individuals only dropped slightly, which should have no effect on how the majority of muni investors value tax exempt muni bonds. This has kept nominal muni yields relatively unchanged. For corporations such as banks that are now subject to a 21% top rate, muni bonds are no longer attractive compared to other taxable bonds of similar duration.
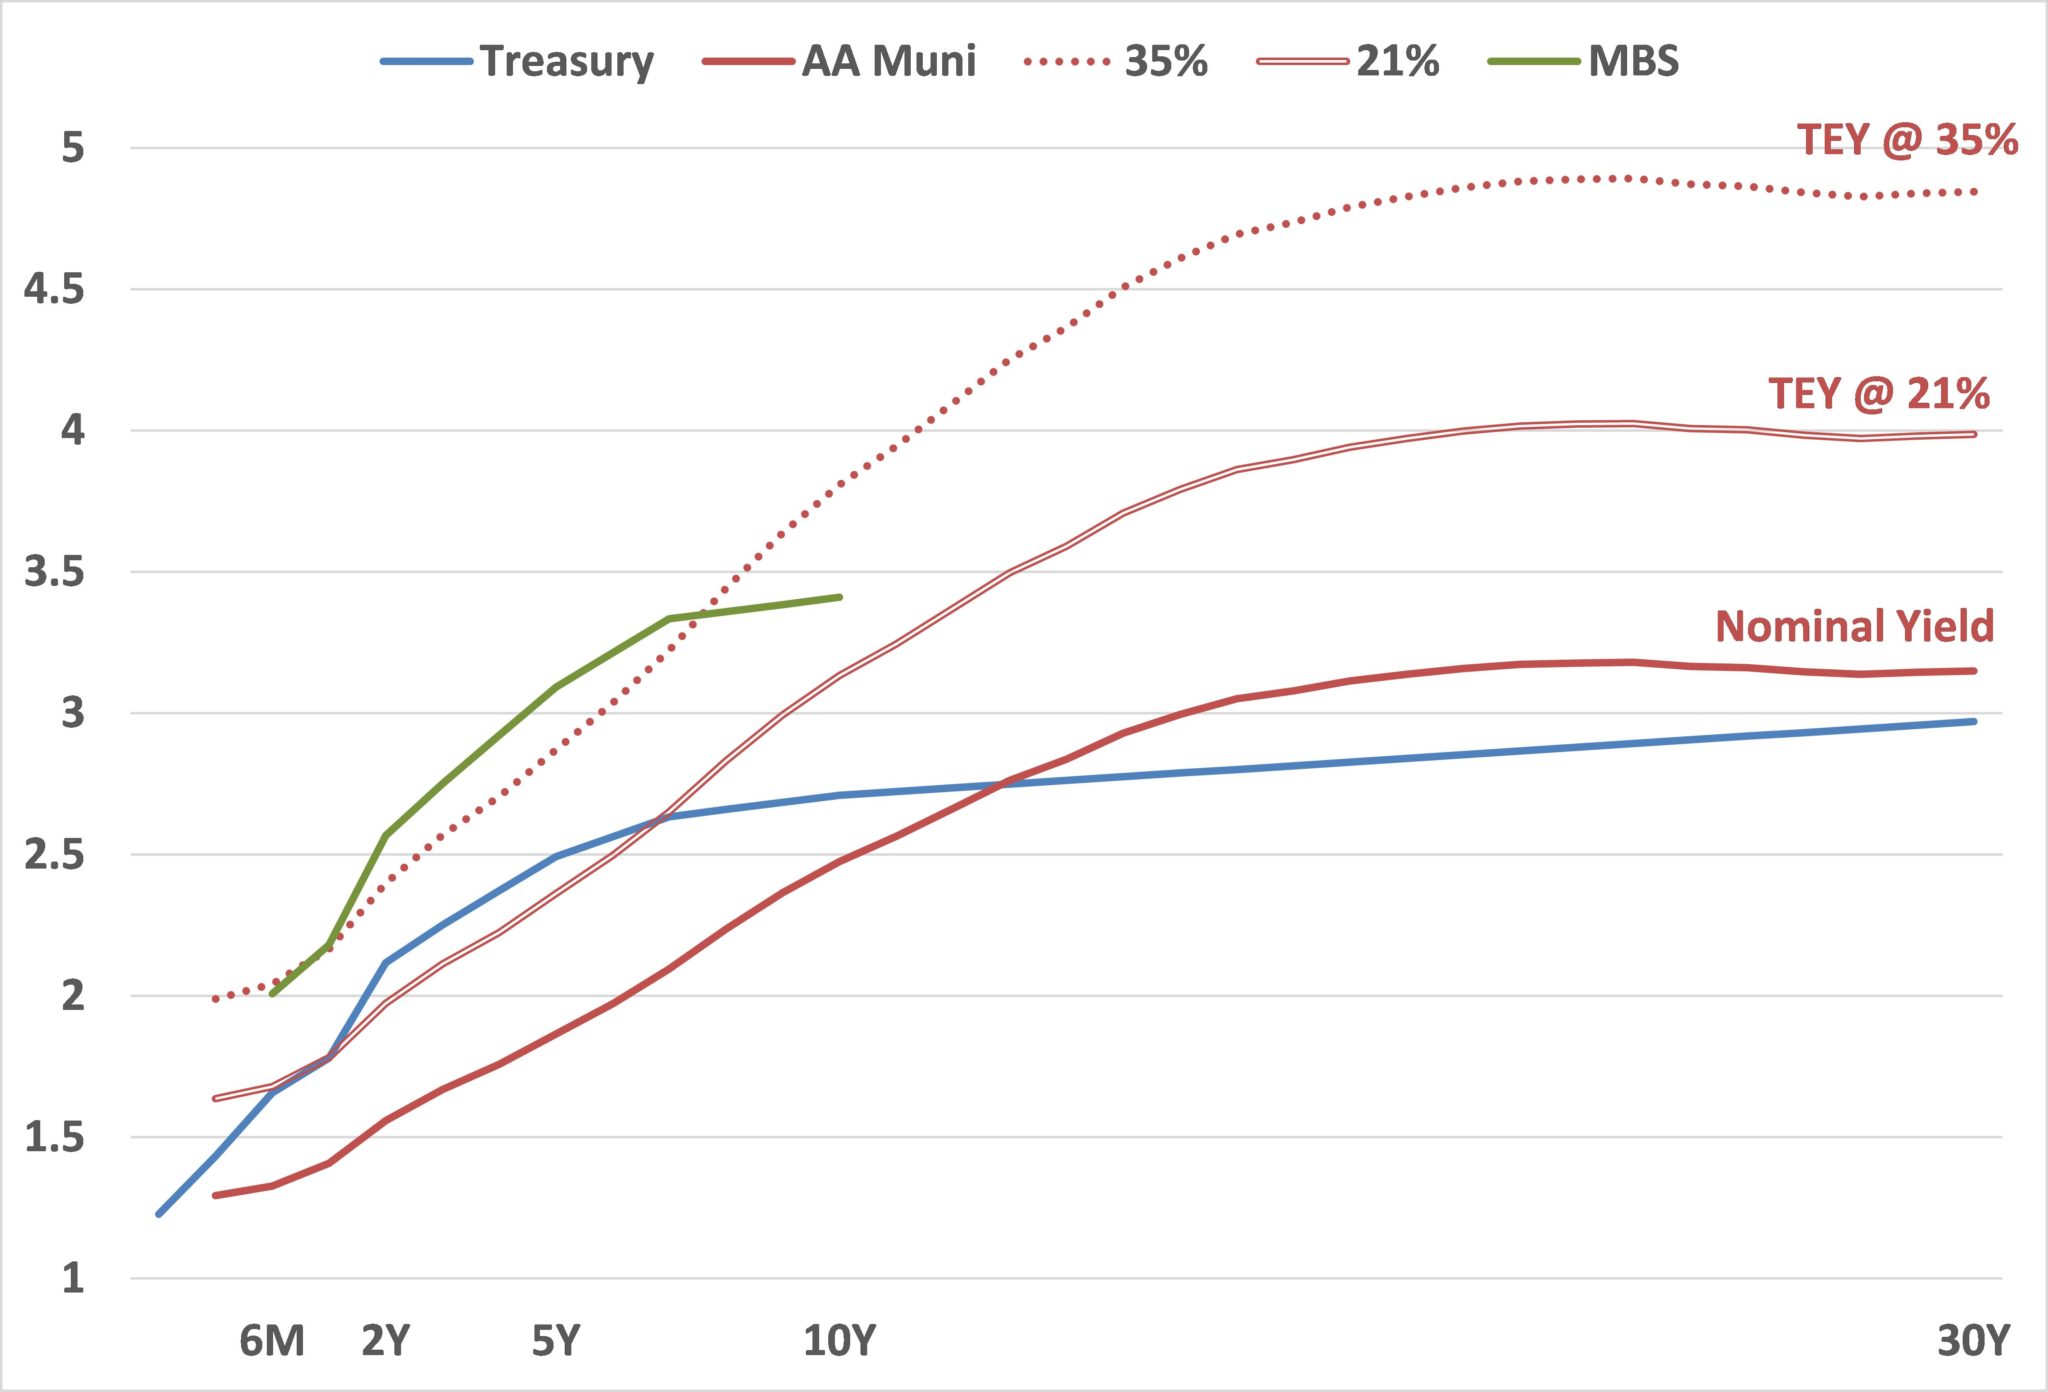
This point is illustrated in the chart above. The blue line is the US Treasury yield curve as a reference point. The red solid line is the Bloomberg General Obligation AA Rating yield curve. This curve is the nominal yield, or after tax yield, for each maturity. To get an apples to apples comparison of tax exempt bonds against taxable bonds, we often gross up the nominal yield based on the tax rate to get a taxable equivalent yield (TEY). The red dotted line shows the muni TEY curve assuming a 35% top rate. This curve is very steep and provides excess return over Treasury bonds at every maturity, with very high yields past 7 years. This is the line that banks would have used to determine relative value in muni bonds prior to 2018.
The double red line shows the TEY for the muni curve for an investor at the 21% top rate. The yield realized at this rate is much lower for all maturities… so low, that the TEY is actually lower than for Treasury bonds until 7 years. This means that corporate investors who buy muni’s with less than 7 years to maturity are accepting lower yields than US Treasury bonds despite the muni having credit risk and a lower level of liquidity.
The green line on the chart follows yields that are available in Agency Mortgage Backed Securities. In the 2-5yr part of the curve where many banks invest, there is about a 70 bps pick up in yield in MBS versus muni bonds.
Comparing the green line with the dotted red line, even at 35% there was little advantage to muni bonds versus MBS on the short end of the curve. This is why we have traditionally recommended that investors buy MBS on the short end and only buy muni bonds with longer maturities. Due to the steepness of the muni curve, that is where there is relative value to be found. Now, for corporate accounts, muni bonds only make sense at very long maturities… longer than what is prudent for many bank balance sheets.
The relative value for muni bonds is fairly clear for new purchases, but what about bonds already in the portfolio? These bonds will see their TEY decline immediately based on the new tax rate. Depending on the maturity of the bond, that will mean a book yield decline of ~40-80 bps. This should warrant an evaluation of whether to continue to hold the bond or not. In some cases, it may still make economic sense to hold the bond even at the lower TEY, but it should be evaluated on a case by case basis.
The good news is that this is happening at the same time as another rule change that may allow some banks to sell Held to Maturity securities. I won’t go into great detail here, but the new derivative accounting standard, ASU 2017-2, allows for a onetime shift from HTM to AFS without tainting the portfolio. Upon adoption, institutions can reclassify callable securities from HTM to AFS. For banks with large portfolios of muni bonds classified as HTM, this may be an opportunity to sell lower yielding muni bonds and reinvest in taxable bonds that offer a better relative value.
These two changes in policy make this an ideal time to review your bank’s portfolio for ways to maximize its after tax return. Let us know if we can help.


