Since the beginning of 2023, the S&P 500 index has grown a staggering 40% through the end of May. While some of this performance has been driven by earnings growth, a lot of it has been good old-fashioned speculation as prices have outrun earnings. This is evident when looking at prices through the lens of company fundamentals.
Consider the price-to-earnings (P/E) ratio. This ratio shows the value investors pay for each dollar of earnings. In the chart below, the S&P is represented in the top line of large-cap companies. Its P/E is currently 24.7. This is the average P/E across the index, but there is a wide range within the individual companies. Value represents the cheap end of the spectrum, where growth is the expensive stocks.
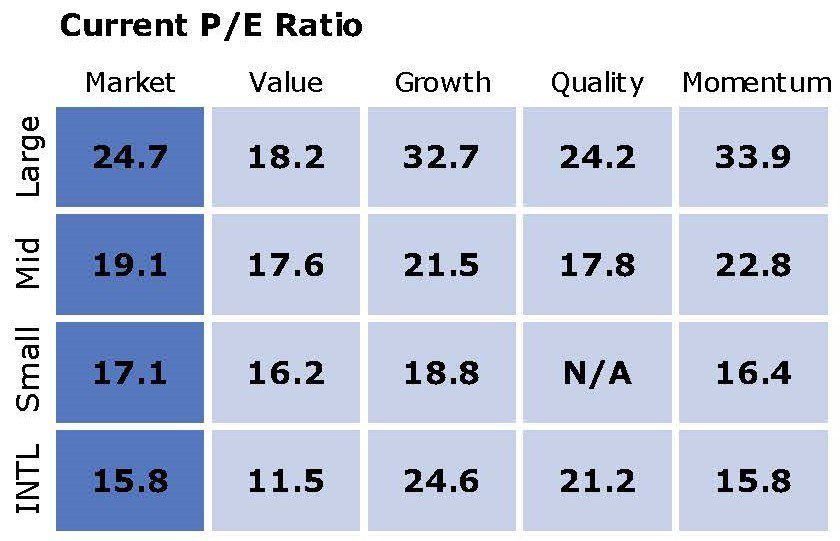
When many talk about the “stock market,” they are referring to the S&P 500. But as one can tell by looking at this chart, there are a lot more stocks in the world than just the S&P 500. While looking across the style box, it is evident that other markets are much cheaper. Mid-cap, Small-cap, and International stocks all trade with P/E ratios significantly lower than the S&P 500.
So, when we hear that stocks are “rich,” what does that mean? How rich? Or, which stocks are rich? This next chart can help put these numbers in context.
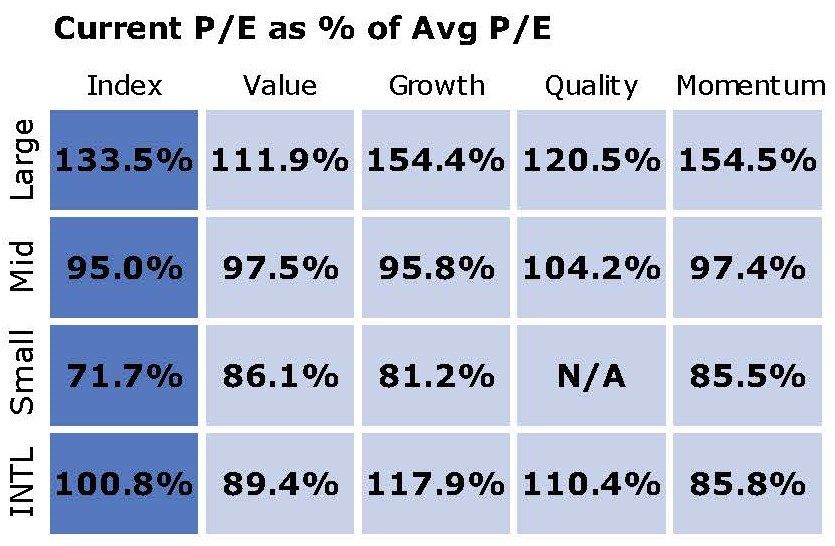
This chart compares the current P/E against its long-term average P/E. This can tell us how expensive or cheap a stock market is relative to its historical track record. For example, International is trading right at its historical average valuation (or roughly 100% of its Avg P/E).
Looking at valuations in this context show that the S&P 500, is indeed very expensive. It is currently trading more than 30% above its long-term average. Much of this is explained by the Magnificent Seven stocks that have dominated the index over the past year. The influence of these high-flying tech stocks, driven by speculation on AI, has pushed the S&P 500 to very rich levels. The growth portion of Large-cap trading at 150% of its average valuation illustrates this point.
In fact, those seven stocks have an average P/E of 43, compared to an average of 17 for the remaining 493 stocks in the S&P 500. That index is certainly top-heavy.
Look again at that chart, and one can see some encouraging news. Although there are seven very rich stocks in the market, there are also a lot of relative bargains out there. Mid-cap stocks are trading a little below their long-term average valuation. Small-cap stocks are extremely cheap, trading at just 70% of their long-term average. International is at its long-term average.
This shows there are still a lot of opportunities in this market. While it may be rich overall, it is driven by a select few stocks. Those stocks are very large and have massive influence over the index. They also dominate the news, so it often feels like they are the market.
However, if we look beyond that group, stocks are priced fairly or even relatively cheap.