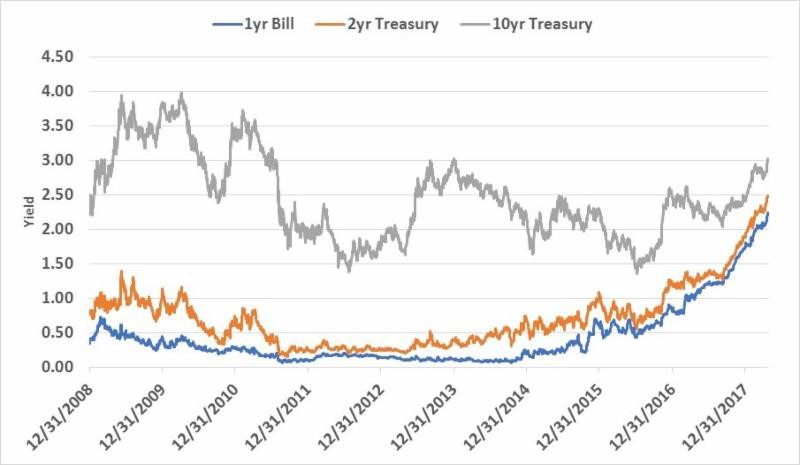
It finally happened. For the first time since 2014, the yield on the 10yr Treasury just traded over 3.0%. For months, many have proclaimed that 3.0% is the Maginot Line that, if crossed, spells impending doom for the markets. While it is easy to get excited about round numbers, the reality is that the economic impact of 3.0% is no different than 2.99%.
The Treasury rate that I really find fascinating right now are short term rates. The 1yr T-Bill is now trading with a yield of 2.25% and the 2yr Note has a yield of 2.49%. These are levels that the market has not seen in over a decade. In fact, the yield on the 2yr note is the same as where the 10yr note was trading just in January!
This development is interesting for two reasons. The first is that it is a result of the curve continuing to flatten. A flat, especially an inverted, curve has been a strong predictor of recession. I have written on this in depth last year, you can click here to read more.
Short term rates are primarily driven by the market’s expectation for Fed action. The Fed has been increasingly hawkish as of late, pointing to 2-3 more rate hikes this year, which would put the overnight rate at 2.25 – 2.5%. Knowing this, the market has repriced short term Treasury yields to compensate for this expectation.
Long term yields are driven by inflation expectations as the effect of inflation is the biggest risk to the value of long term bond cash flows. With a strong economy and tight labor force, market expectations for future inflation have been increasing, which have pushed up the yield on the 10yr Treasury, but not as fast as short term rates.
The gap between the two is rapidly closing. If the Fed continues to be aggressive and inflation moderates, the yield curve could be flat by the end of the year.

The more practical reason this is interesting is how it drives investment decisions. The risk/return relationship amongst different maturity bonds has dramatically changed over the past two years. When the yield curve was steep, investors were provided with a handsome incentive to accept longer maturities. Now, that extra compensation is shrinking. This should get investors questioning: at what point is the additional risk not worth the additional return?
The risk exposure is easy to estimate. Each year of duration for a bond is roughly equal to a 1% change in the bond’s value for a 100 bps change in yield. So, if interest rates change 100 bps, a 1yr bond’s price would change ~1%, a 5yr bond’s price would change ~5%, and a 10yr bond’s price would change ~10%, etc.
This risk to market value does not change. What does change is the compensation that investors receive for taking additional duration. When the yield curve is steep, investors have an incentive to move out and take on more risk. This incentive is in the form of higher expected returns.
The expected return of a bond can be decomposed into three components: (1) the yield of a bond over its holding period; (2) capital appreciation (or depreciation) of the bond due to the shape of the yield curve; (3) and changes in bond prices due to future changes in yields. There is no reliable way to predict future changes in yields due to unanticipated future events that are not yet known. However, there is reliable information in the first two components of expected return that enables us to use current bond prices to identify securities with higher expected returns.
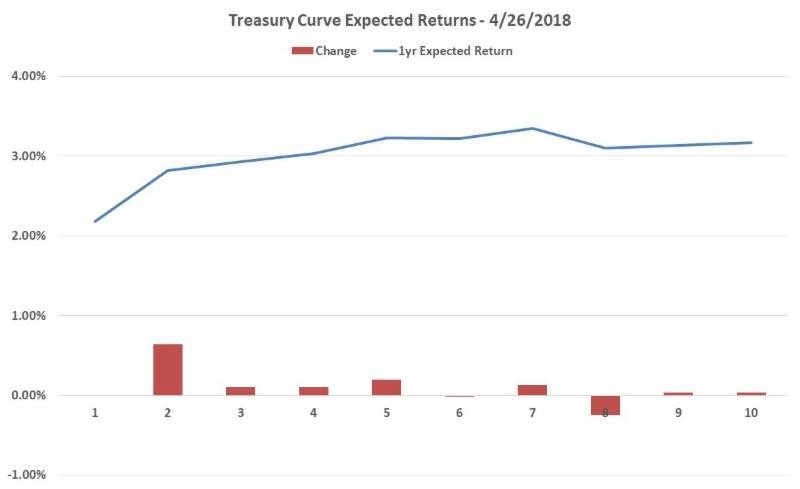
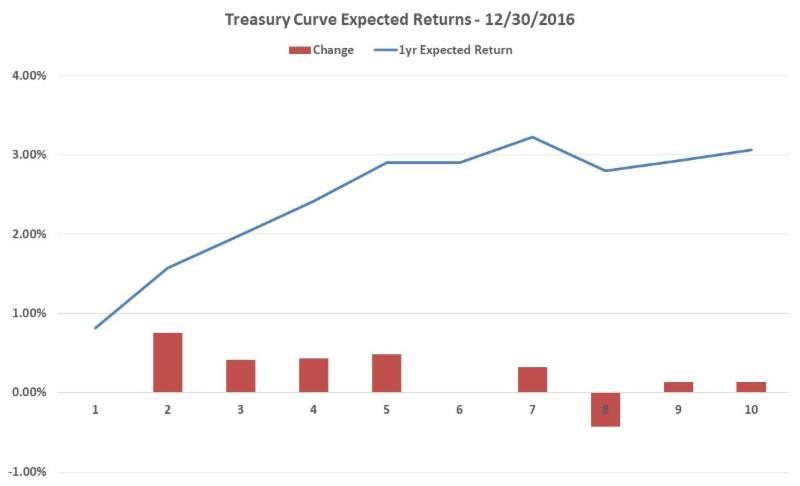
This is illustrated in the charts above. These charts show our model of expected returns for the US Treasury market as of November 2016 and the current curve. As yields have increased, expected returns have increased for most maturities. During this time, the curve has flattened, which has also led to a flattening of the expected return curve. A flatter curve means there is less expectation for capital appreciation of a bond as it rolls down the curve (#2 in the above paragraph). Most of the return today simply comes from the yield.
In 2016, investors could expect to earn an additional 200 basis points by purchasing 7yr bonds rather than 2yr bonds. Today, for taking the same risk, investors would only earn an additional 50 bps in expected return. In today’s curve, expected returns reach their highest point around a 5yr duration. For this reason, longer term bonds currently represent uncompensated risk.
This risk-return dynamic can help us determine value in bonds. Overall, the good news is that while yields have increased, expected returns for the future are now much higher. While the focus has been 10 year yield, the real value in the today’s market is quite a bit shorter.