The yield curve has been a very hot topic lately in the financial news media. Multiple times a day, there are commentators pointing to the yield curve as a sign that markets are on the verge of imploding. Is it time to panic?
The Federal Reserve has continued to push short term rates higher throughout 2017. Long term rates have responded by falling 10 bps. This has led to a flatter yield curve. As of this writing, the difference between the yield on the 10yr Treasury and the 1yr Bill is 80bps, down from a post-crisis high of 354bps and from 166bps at the beginning of the year.
This trend points to tighter monetary conditions that could have negative consequences for the economy. An inverted yield curve, where short term rates are higher than long term rates, has predicted the past seven recessions since 1960. This is the source of the old adage that bull markets don’t die of old age, they are killed by the Fed.
Long term interest rates are market driven. Their yield is settled by the supply and demand of market participants along with their expectations for future growth and inflation. Short term rates are manipulated by the Federal Reserve. Therefore, a flat or inverted yield curve occurs when the market believes inflation or short term rates will fall, where a steep yield curve expects higher rates in the future.

The chart above clearly shows that the yield curve is flattening, but it is still positive. At what point should investors be concerned?
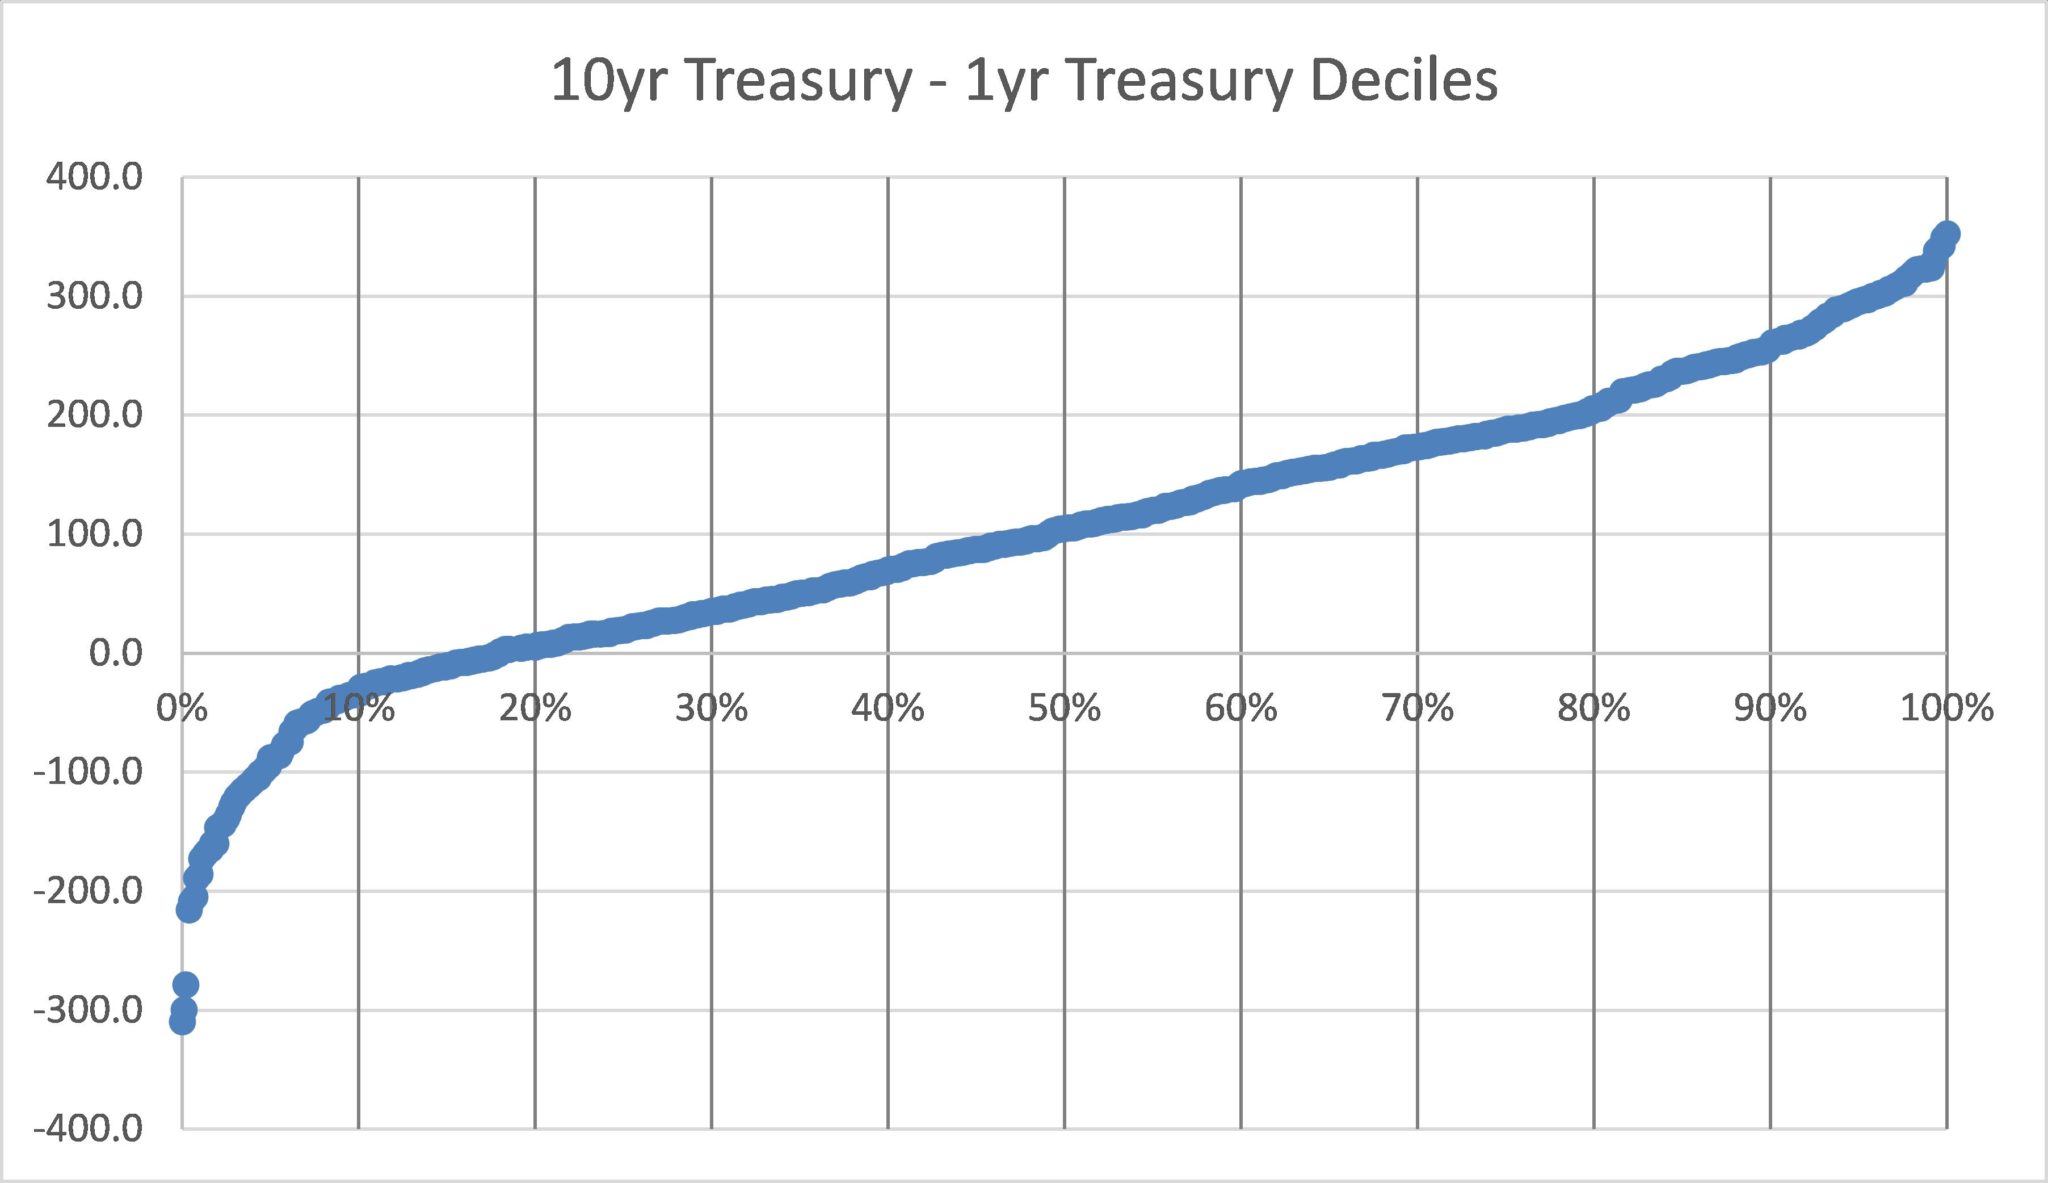
To answer this question, we look to determine if there has, in fact, been a historical relationship between the yield curve and the economy, stocks, and bonds. Starting in 1962, we have calculated the spread between the 10yr Treasury and the 1yr Treasury on a monthly basis. We then ranked each yield spread and divided them up into deciles. This allows us to then examine how different levels of steepness have translated into economic growth and market returns.
The chart below illustrates this decile ranking. One thing that stands out is that the yield curve has been negative, or inverted, about 15% of the time, with about 5% of those months being very negative.
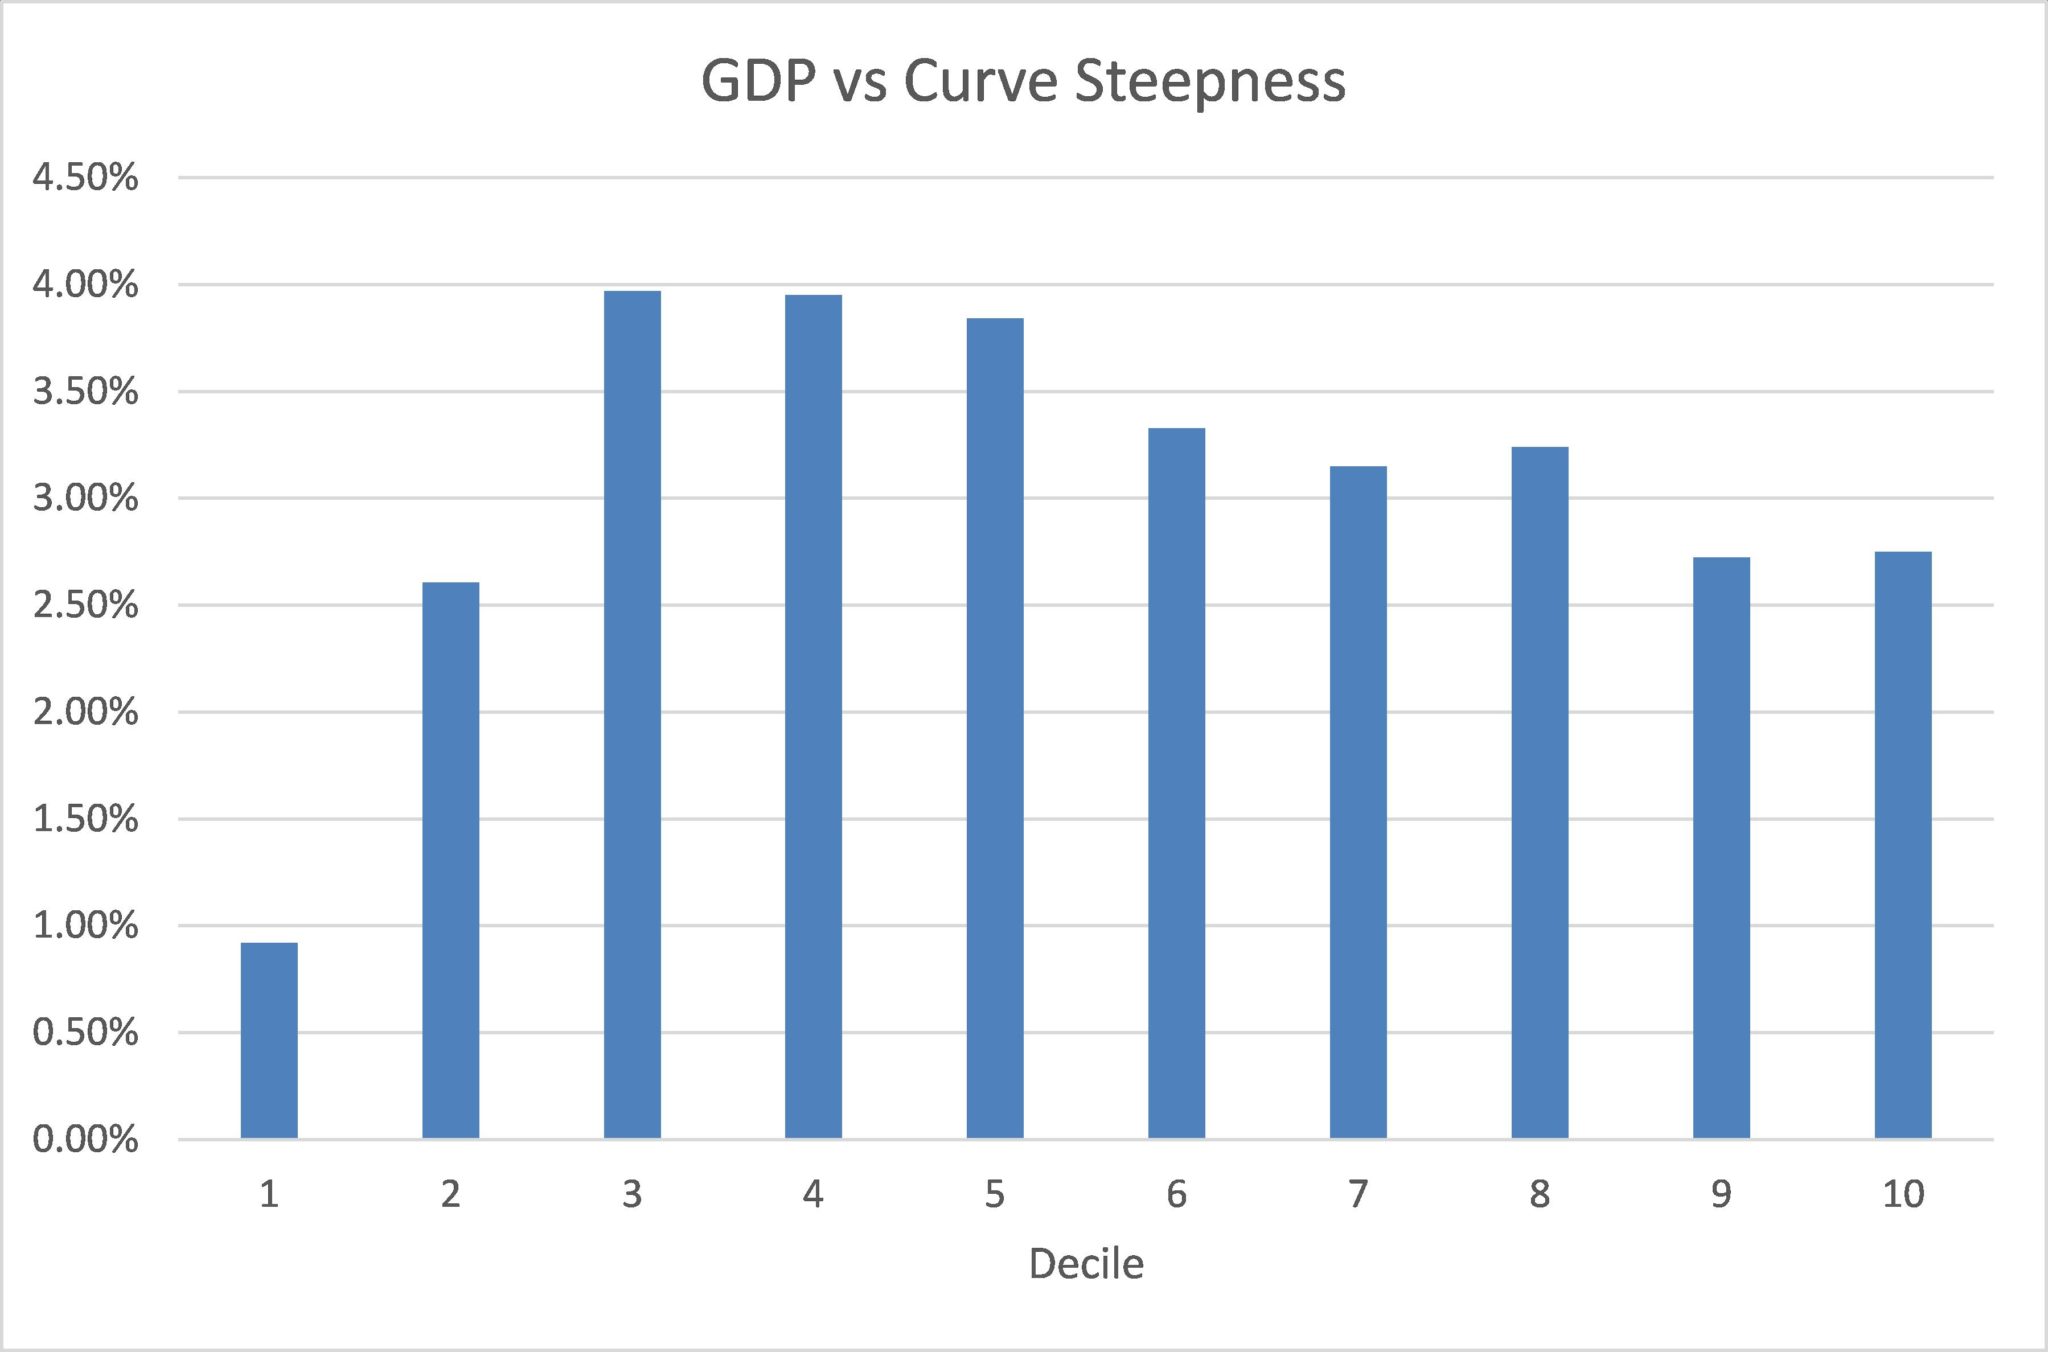
First, we wanted to see if there is a connection between curve steepness and economic growth. An inverted curve has preceded past recessions, so there would appear to be a connection. For each monthly yield spread, we calculated the actual GDP growth for the following 12 months. We then averaged the 12 month return data for each corresponding decile.
The results are in the table below. As expected, the yield spreads in the first decile are associated with very low GDP growth on average. Said another way, it appears that inverted yield curves are associated with poor economic growth. That is an expected outcome. What is interesting is the pattern that develops in the other deciles. Growth appears to be below average in the second decile too, as most of the yield curves in the second decile are inverted or flat. The yield curves in the middle deciles show the highest average GDP growth, with the steepest curves (on the right) displaying some weakness.
Thinking about a typical business cycle and the monetary response, this actually makes a lot of sense. Both inverted curves and steep curves typically occur around inflection points. As the Fed drives up short term rates and inverts the yield curve, it chokes off credit and growth in the money supply, which slows the economy. With inverted curves often leading to recession, what follows has been aggressive monetary easing, which results in a steep yield curve. Therefore, the extremes of yield curve steepness (deciles 1, 2, 9, &10) are associated with economic weakness.
As of this writing, the spread on the current yield curve is at 80bps, which would put today’s yield curve in the 5th decile. Contrary to the alarms being raised in the media, the historical record shows that today’s yield curve is associated with above average GDP growth for the following 12 months.
There appears to be a loose connection between the yield curve and GDP. Now, we consider the effect this relationship has on financial markets.
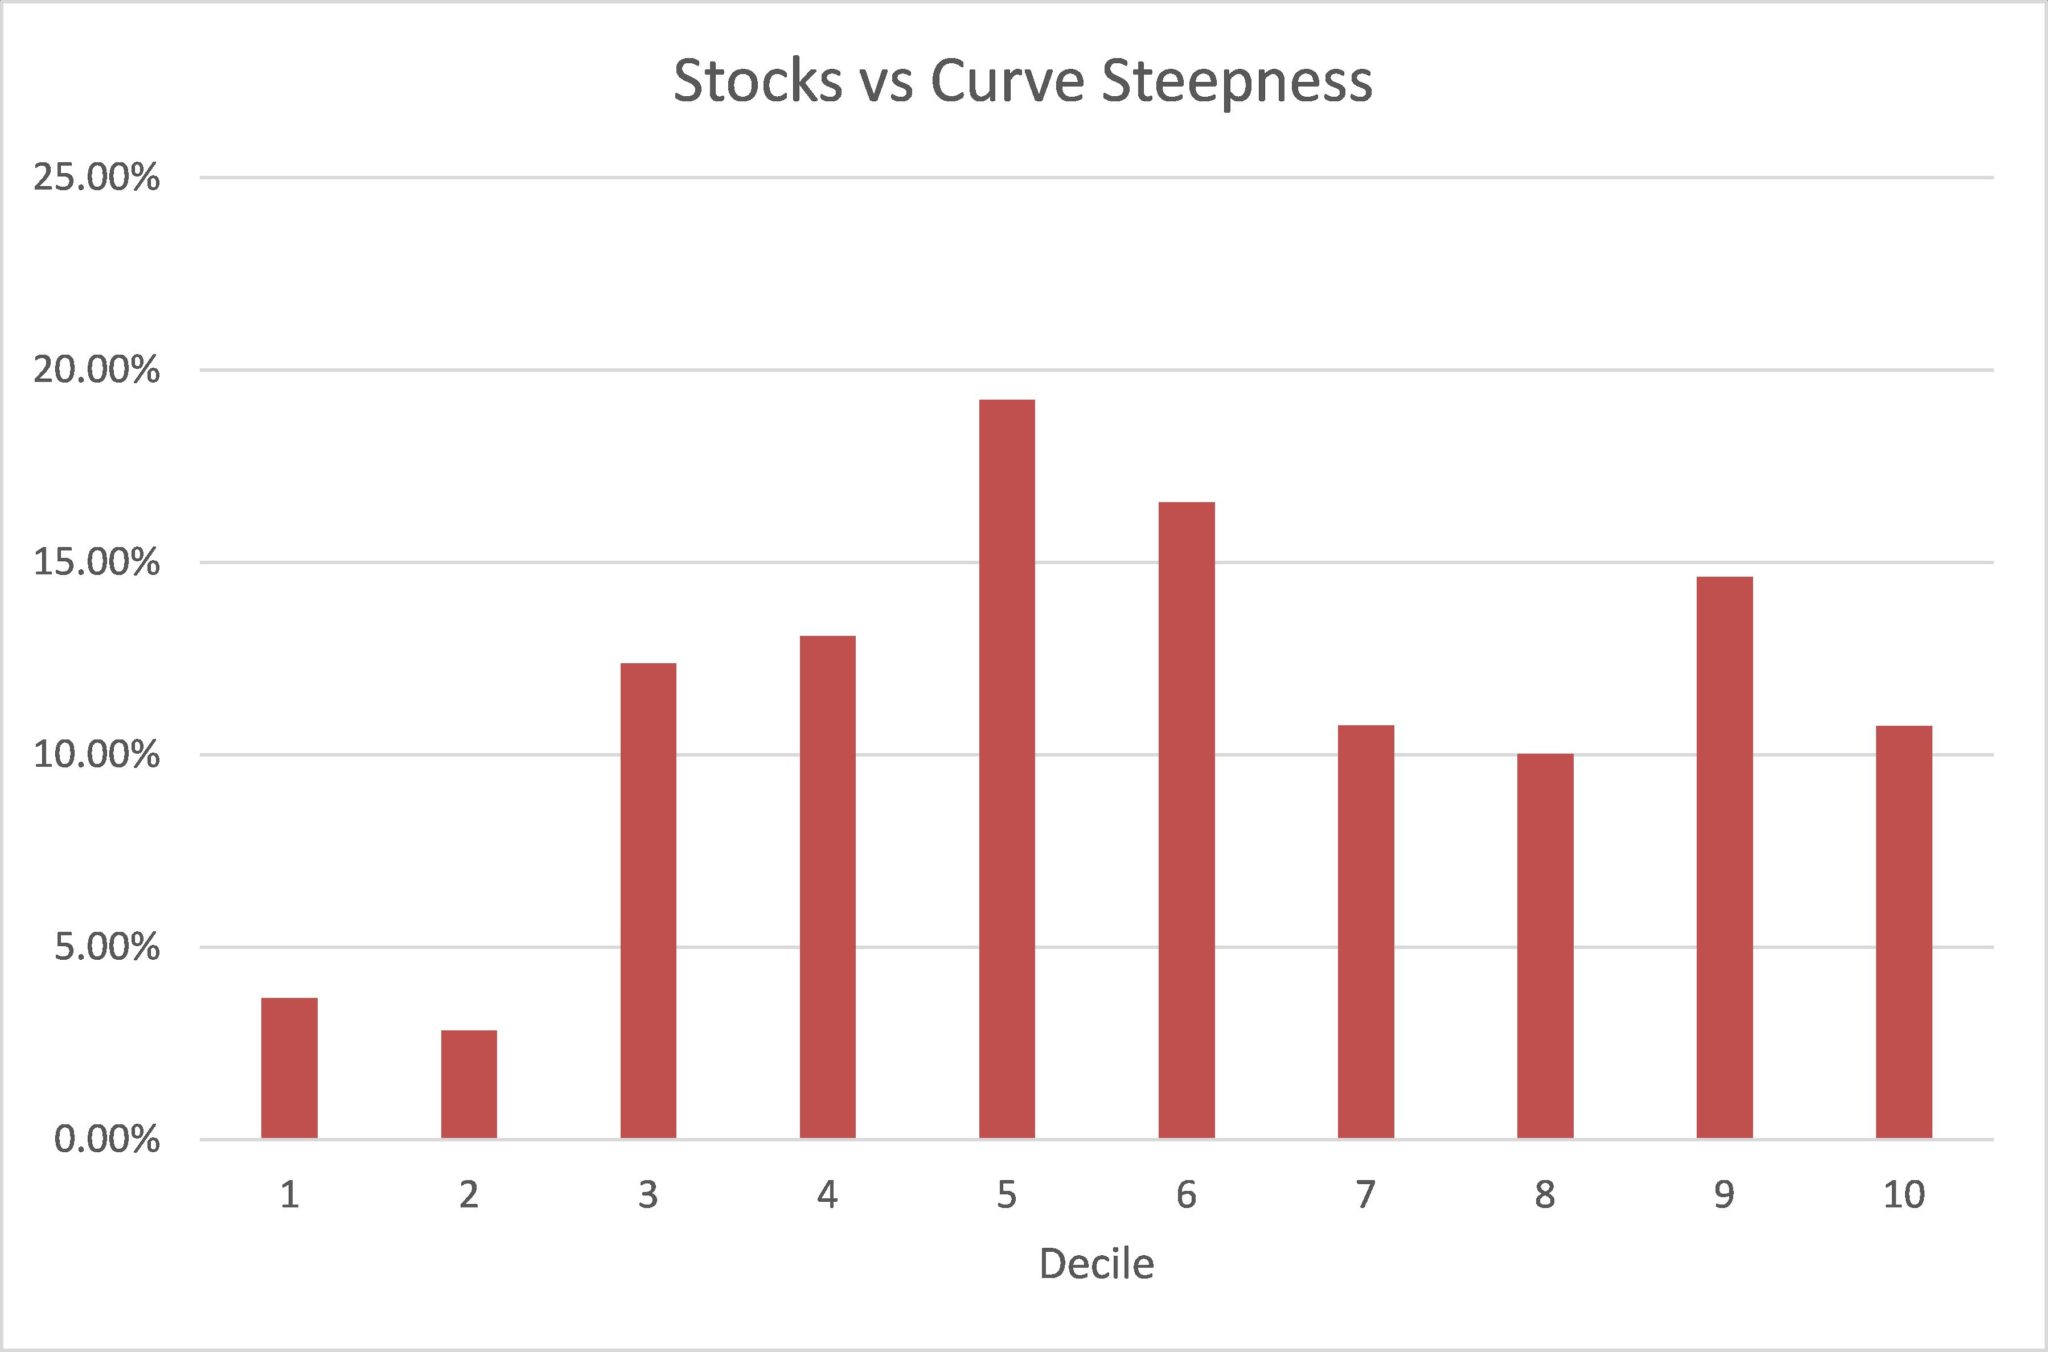
Using the same method, we compare the average 12 month ex-post returns for the S&P 500 for each decile of yield spread. The results support the adage that the Fed kills bull markets. Yield curves that were inverted or flat (those found in the first two deciles) produced the lowest average returns by a substantial margin. This supports the thesis that tighter monetary policy chokes off investment and is bad for stock investors.
Like GDP, the highest average returns where in the middle deciles. This makes sense as these are often the goldilocks periods. The Fed is not too tight, and not too loose. This is where there is stability and confidence which fosters both economic and market growth.
As for today, the 5th decile has produced the highest average returns in the stock market. According to this single indicator, the next 12 months has the potential for stocks to post strong returns.
Next we look at returns in the bond market. Averaging out returns of the whole market does not make much sense since the long end and the short end of the curve are behaving very differently. Therefore we segregated the market and compared the 12mo ex-post returns for an index of Short Term bonds (red bars) as well as the returns for an index of Long Term bonds (blue bars). The results are very interesting.
The chart below illustrates a distinct pattern. Clearly, short term bonds perform much better in flat or inverted yield curves and long term bonds perform much better in steep yield curve environments and underperform as the curve flattens.
Again, intuitively this makes perfect sense. In a steep yield curve, long term rates have an advantage in carry as their income is much greater than shorter bonds. Also, those curves in the steepest deciles can only move flatter, which is often a result of long term rates falling, causing prices to increase.
Short term bonds outperform when they have the advantage in carry, or when their yield is higher than long term bonds. As the curve begins to steepen, this is typically due to short term rates increasing (Fed tightening) which also hurts bond prices.
Back to today’s curve… the 5th decile shows that, on average, Long Term rates have outperformed Short Term rates. Again, Long Term rates have the yield advantage to begin with. The middle decile probably has as many examples of curves that are steepening as well as curves that are flattening, which makes the capital appreciation/depreciation fairly moot over time. (Long Term rates have a slight advantage as they have been on a downward trend for the last 30+ years, which makes up the bulk of this timeframe.)
This chart is a great illustration why Acropolis employs a variable maturity approach to managing fixed income portfolios. The risk/reward of bonds changes as the curve changes. We as investors should look to invest in the optimal place on the yield curve given this profile.

Based on the historical record, the alarms that so many are raising about the current yield curve signaling impending doom seem exaggerated. Certainly there are heightened risks in today’s markets. The danger for investors is acting on a single indicator. Markets and economies have had periods of strength and weakness in all deciles of rate scenarios. The markets could fall precipitously tomorrow for reasons other than the steepness of the yield curve, or they could boom for a time despite the curve going inverted. After all, these are just averages.
While there appears to be a connection, it is just one of many indicators in a dynamic economy. While this study shows that there are more examples in history of market outperformance than underperformance given the current yield curve, it would also indicate that it is not time to panic until the spread approaches zero or goes negative. That may (or may not) happen over the next year or two, but is unlikely to happen overnight.