Even though the S&P 500 closed flat on Friday, it was down substantially in the middle of the day, down -2.3 percent in the late morning.
At that moment, the S&P was down more than 20 percent from the all-time high set in January. Since a bear market is generally defined as a -20 percent decline from the recent peak (also called a drawdown), a lot of digital ink was spilled saying that a bear market is upon us.
In a way, the exactness doesn’t matter – we’re down meaningfully from the high, which is the point. Is it helpful to know that technology stocks are in a bear market, down -25.2 percent? Or communications and consumer discretionary stocks, which are down -27.6 and -31.8 percent respectively? What about the Nasdaq or Russell 2000?
I’m not sure that it really matters, except when you’re looking at historical data and you need a definition to get a sense of what bad markets look like.
To that end, I pulled up a unique data set created by one of our interns a few summers ago. Typically, when we look at historical data, we look at either daily price change or monthly total return data. The total return is the price change plus the dividends. Our intern created daily total return data, which is more precise than the commonly found other data.
The chart below shows the daily total return drawdown history back to 1928. I highlighted the -20 percent threshold to illustrate the frequency and magnitude of bear markets with that definition.
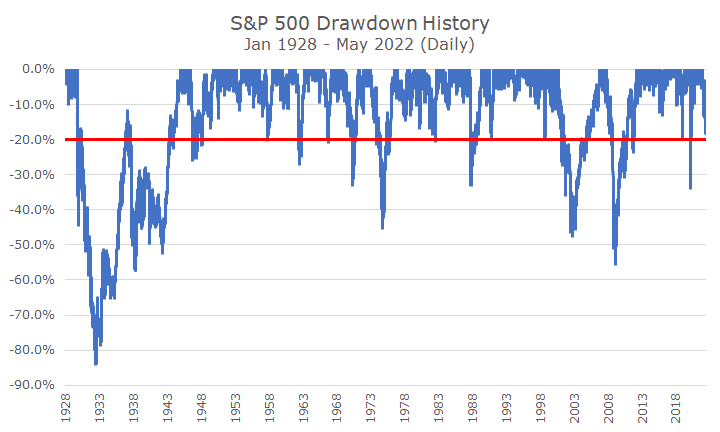
For the purpose of the article, I basically ignored the Great Depression, since I don’t think that’s on the table. It’s unique for several reasons, partly because there are at least two bear markets inside the big bear market, which requires a more precise definition. But as you can see, I included it in the chart.
If you just count the number of times the blue line crosses through the red line, you can see that there were nine bear markets since the Great Depression.
I was interested to look at the nine bear markets in more detail, so I created the following chart that looks at two things.
First, I wanted to see how long a bear market lasts. The start date is defined as when stocks first fell below -20 percent from their recent high. The end date is when stocks finally recovered from that loss.
The total drawdown is longer because I ignore the first -20 percent loss, but I wanted to know how long bear markets lasted from the -20 percent point.
Some are pretty short, like the Covid-related loss, which was four-tenths of a year, or five months. The worst is the Tech Wreck, which took 5.6 years to recover from. Using this data, a bear market averages two years to recover from the -20 mark.
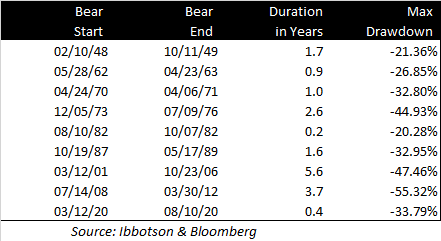
The second thing that I wanted to know was how bad each bear market got, or the maximum drawdown. I didn’t mean to be confusing, I calculated the drawdown from the peak, not from the -20 percent threshold, so I’m not consistent exactly.
For example, in the 1948 bear market, the max drawdown was -21.36 percent. So, by the time the market had fallen -20 percent, it was almost at the bottom of -21.36 percent. It didn’t fall -21.36 percent from the -20 percent mark.
Of the nine bear markets, a third of them lost between -20 and -30 percent. That’s the good news because if that’s what we get, we’re through the worst of it since we are down -18.19 percent as of Friday.
However, there are three periods, where the losses are between -30 and -40 percent. If that’s what we’re in for, then we’re only a little more than halfway to the bottom.
And then there are the three losses that exceed -40 percent (one of which was more than -50 percent). The loss that we have today is only 30-40 percent of those losses, which would suggest a lot of agony ahead.
It may be wishful thinking on my part, but I don’t think that’s where we are headed. I don’t think the inflation problem that we have today is bad as it was in the mid-1970s, that valuations are as bad today as they were in the late-1990s, or that the financial system was insolvent, like in 2008.
There’s no doubt that we have an inflation issue and that valuations are high, but not like those times, in my opinion (and I should hasten to add Acropolis doesn’t have an official, firm-wide view).
Yes, bad things could happen. But, in addition to the three bear markets that didn’t get a whole lot worse, there were also four times where the market fell by something just short of -20 percent and then recovered without entering a bear market.
And that’s where we are now: just short of a bear market, despite what’s happening in tech stocks and the other sectors that I mentioned earlier. In a few years, it will look obvious that markets would turn around or get worse, but right now, we just don’t know.
That said, I think we should all accept the idea that even though we haven’t hit a bear market yet, markets are likely to continue to be tough for a while. As I’ve noted before, this is no fun at all, but we’ve planned for this.

David is a trusted advisor to 50 families, delivering comprehensive financial solutions, including financial planning, investment management, cash management, tax planning, estate planning, and charitable giving. As Chief Investment Officer, he leads the Investment Committee and the research and trading team. His team continuously evaluates investment strategies and securities, working closely with Portfolio Managers to implement them effectively.