What a difference week makes!
Last week, with the market down -18.2 percent from its all-time high and dipping into bear market territory at some points during the day, it felt like a bear market was a sure thing.
Of course, it may still happen, but with stocks now down -12.8 percent, it doesn’t feel as imminent.
Last week’s article focused heavily on bear markets, almost to the point of excluding the good results that markets enjoy. So, this week, using the same unique data set as last week, I want to put the bear markets in context.
The chart below shows the growth of $1 from the start of good data in 1926 through Friday. As noted last week, this is our own data, that shows the daily total return (price plus dividend).
I’ve also color-coded the different bull and bear market periods. I’ve colored the drawdown in red, which is the peak-to-trough market decline.
Then, I’ve highlighted what I’m calling recovery, in yellow, which is the period between the trough of the bear market and back to recovery. The rest are bull markets, highlighted in green.
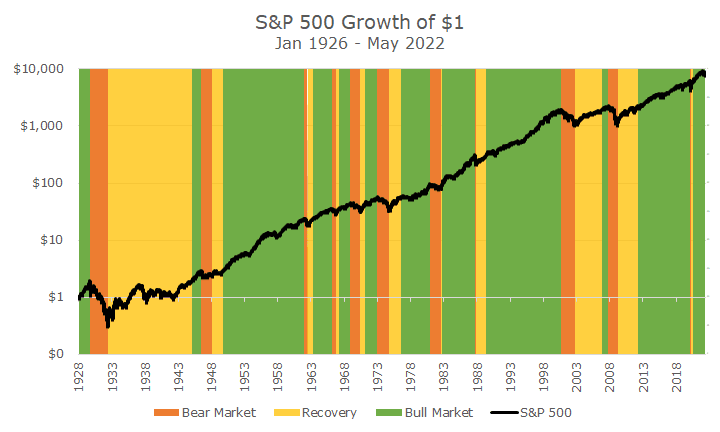
The big point from this picture is that the bear markets are all transitory; they come, and while you don’t know how far down they will drop or how long they will last, they pass.
On average, the peak-to-trough portion is pretty short, but the recoveries can take a long time. Of all of the days in this history of the S&P 500, 15.3 percent of them are in bear market drawdowns, 28.9 percent are spent recovering from those bear market drawdowns, and the remaining 55.8 percent are spent in bull markets.
Although it makes sense that big drawdowns have protracted recoveries, the chart tells a number of different stories. Take a look at the 1982 drawdown, where there is a lot of red and barely any yellow. The market took a long and painful descent but snapped back almost immediately. It’s just the opposite in 1987 when stocks fell more than 20 percent in one day.
The only problem with this chart is that everything is highlighted with perfect hindsight. I can find the exact tops and bottoms and color accordingly.
Right now, for example, the current market is green because we haven’t had a 20 percent drawdown. If we end up in a bear market in the next few weeks, I’ll go back and recolor everything from Jan 3rd from green to red. But, that’s a big if. As I said last week, we won’t know for a while whether this market turns into a bear or not.

David is a trusted advisor to 50 families, delivering comprehensive financial solutions, including financial planning, investment management, cash management, tax planning, estate planning, and charitable giving. As Chief Investment Officer, he leads the Investment Committee and the research and trading team. His team continuously evaluates investment strategies and securities, working closely with Portfolio Managers to implement them effectively.