I didn’t apply to Harvard because I was certain that they would not admit me.
My grades were fine and scores were so-so, but at that time they were accepting only nine or ten percent of applications and I knew that the other kids had top grades and scores AND were fluent in four languages, captain of multiple teams and fought poverty on the side. Or, worse yet, their parents were alumni and give a lot of money.
Okay, so I’m a teensy tiny bit bitter, so when I saw the Harvard endowment asset allocation, I was excited because I could tell right off the bat that Acropolis clients had better results last year than the Crimson Cash.
All kidding aside, the Harvard and Yale endowments are watched closely by other investors because their records are tremendous. The Chief Investment Officer at Yale, David Swenson, wrote one of the most influential books in recent times, Pioneering Portfolio Management: An Unconventional Approach to Institutional investment. Although it was published in 2000, it’s timeless and I refer to it regularly.
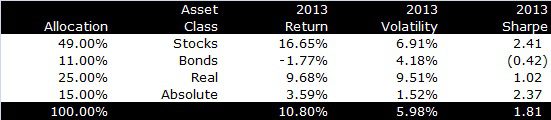
The Harvard endowment has four asset class: stocks, bonds, real return and absolute investments. The stocks and bonds should be pretty familiar to you, but the real return and absolute investment categories probably need a quick explanation.
Real asset are tangible, unlike financial assets, have some intrinsic value due to their utility, are lowly correlated to stocks and bonds and offer meaningful inflation protection. Harvard has three segments to their real assets allocation: commercial real estate, natural resources and traded commodities.
Absolute return investments (a term coined by David Swenson) are strategies that should earn positive returns without any correlation to other financial or real assets. For example, merger arbitrage, is an absolute return strategy since it has a positive expected return that isn’t associated with stocks or bond returns.
The following table shows my estimate of their policy return. A policy return is what the Endowment would expect to earn based on their asset allocation without accounting for manager over/under performance.
For example, if an Investment Policy Statement calls for a 100 percent allocation to the S&P 500, the policy return last year was equal to the S&P 500 return and would not account for any manager over/under performance.
It’s still an estimate because I don’t know what indexes they benchmark themselves against and there are two asset classes where I don’t have a good proxy for any policy index. For example, Harvard allocates 16 percent to private equity, and had to use data that only went through September 30th (I used the fourth quarter of 2012 to represent 2013 – it’s not right, but it’s something).
The same was true for natural resources. I used an index of natural resource stocks, but this isn’t the same as owning the resources themselves. Yale is famous for owning timber – the land increases in value and wood is a renewable resource that also increases with inflation. A timber stock will act differently than a large swath of wooded land.
These notes aside, I can saw with reasonable confidence that their return was around 10.8 percent for calendar year 2013. The table below looks at the results of their for major asset classes.
Now, for reference, I did look at the policy return for a typical 60/40 stock/bond allocation at Acropolis.
Of course, client results may vary, this doesn’t account for manager over/under performance, etc., but should give some idea of how a conventional stock/bond mix performed.
This conventional allocation earned around 15.5 percent and the volatility was approximately six percent for a Sharpe Ratio of 2.5 or so. The returns were higher, but the volatility was about the same, resulting in a much better risk-adjusted result. Not too shabby, Acropolis!
What accounts for the difference? It turns out that the stock allocation was a major determinant of performance differences. As discussed recently in Daily Insights, Acropolis has a home bias and 2013 was a great year for US stocks. It was great for other developed markets but less so and a lousy year for emerging markets.
For their public equity allocation, Harvard equally weights between the US, developed and emerging markets stocks and that hurt last year in relative terms.
There are other differences to be sure, but this had the most impact on returns. Think about it like this, in a 60/40 stock/bond mix, we had 42 percent invested in publicly traded US stocks, which gained 33.6 percent and Yale only had 11 percent of their portfolio invested in publicly traded US stocks.
This isn’t a criticism of Harvard, since this is just one year and investment strategies should be judged over many, many years. Also, I want my kids to have a shot at admissions.

David is a trusted advisor to 50 families, delivering comprehensive financial solutions, including financial planning, investment management, cash management, tax planning, estate planning, and charitable giving. As Chief Investment Officer, he leads the Investment Committee and the research and trading team. His team continuously evaluates investment strategies and securities, working closely with Portfolio Managers to implement them effectively.