I thought it would be interesting to see how the market correction this month impacted long-term market valuations, most notably, the Shiller PE ratio. Unlike a standard PE ratio, the Shiller PE ratio compares the current market price to the average inflation-adjusted earnings for the previous 10-years.
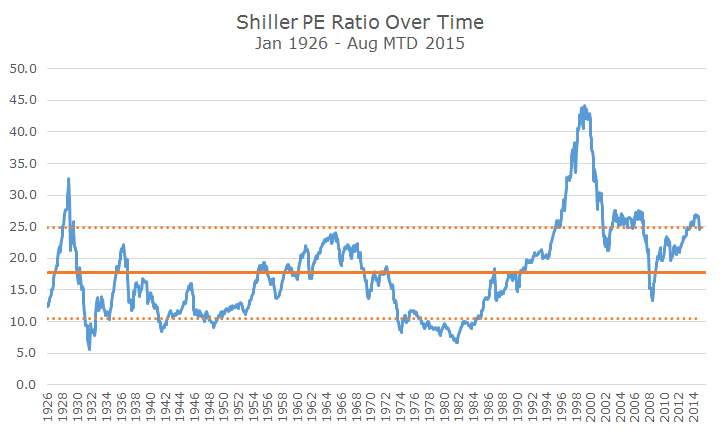
The chart below shows the Shiller PE ratio (in blue) back to 1926. The solid orange line depicts the average Shiller PE ratio over that period and the two orange dotted lines show one standard deviation away from the average.
I think that’s a fair band to describe market conditions as either ‘expensive’ when its above the high orange dotted band and ‘cheap’ when the PE ratio is below the bottom orange dotted band.
When the Shiller PE crossed over the orange dotted band line 2014, it was the basis for a Daily Insights entitled ‘The Market is Overvalued, Now What? and followed up with another article titled ‘Five Years of Bull’ and included a picture just like the one above.
I wrote that the market can stay overvalued for very long periods of time and that valuation doesn’t explain enough about market returns to trade on the information.
Although it might seem otherwise, I’m not running a victory lap here. While it’s true that the market is basically even since it crossed that upper orange band, I think it’s pure coincidence and nothing more.
To further illustrate that point, I thought I would provide an alternate Shiller PE ratio that is entirely credible and paints a different picture than the one above.
Although I like the Shiller PE ratio, I think it suffers from inflexibility – it assumes that valuations should be the same over time and I don’t think that’s true.
I think that stocks were much riskier 50 years ago than they are today for a bunch of reasons: investors couldn’t diversify (in the US or overseas) as easily due to high costs and operational burdens, there was less information available, insider trading was legal, corporations weren’t as efficient and there was no academic theory or body of evidence like there is today.
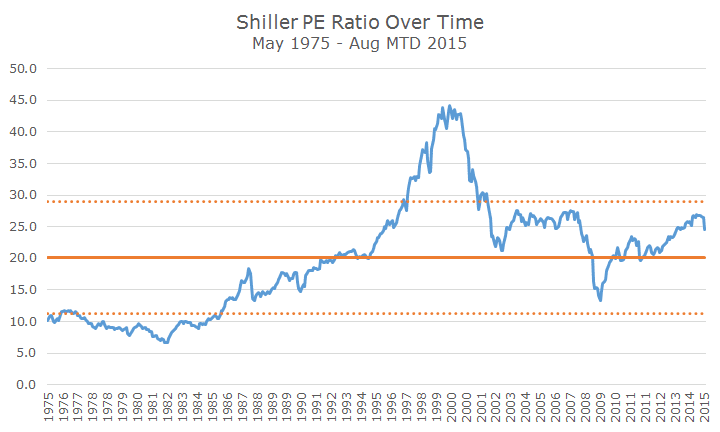
It makes sense to me that investors would be willing to pay more for stocks today than they would have 50 years ago. So, I picked an arbitrary date, May 1, 1975 (so-called May Day) when brokerages were deregulated and high fixed fees were abolished, to mark when ‘modern’ investing began. Arbitrary, but not totally arbitrary.
The Shiller PE ratio is the same, but the average Shiller PE ratio is higher (20 vs. 17.5), which also affects the Shiller PE band. During this time period, you still see that stocks were deeply undervalued in the 1970s, the tech bubble was still totally outrageous, the 2008 financial crisis created bargains and we are still on the expensive side, but not as much.
As I say, I think this is equally as credible as the first chart, but I am also skeptical of any ‘new, permanent plateau’ theory because, who knows, valuations could really fall from here.
I could also pick five years’ worth of earnings to look at instead of 10 – what’s so magic about 10 years? If I do that, the earnings bust in 2008 falls out of the earnings and PE ratios were already coming down before the recent correction.
I think that’s credible too, but I didn’t make a chart because I just want to get the idea across that there are faults with all of these analysis – your assumptions and inputs materially impact the outcome.
So where does that leave us? I still think that markets are overvalued – the original Shiller PE and my two alternate theory versions all say something to that effect along with other measures like Tobin’s Q.
I have to conclude with the same thing that I did at the beginning of last year – we don’t know where the market is going, especially in the short run; and the short run is measured in years, not the coming days, weeks or months.
That said, I still believe that stocks will earn more than bonds or cash over the long run and investors who try and time the market will almost certainly fall behind the buy and hold crowd. It’s not easy and the next five years will be harder than the last five and while the returns aren’t likely to be as good, it’s still the best alternative.