During the tech bubble in the late 1990’s, I had the feeling that seeing five years of 20 percent plus returns was a one in a lifetime type event and that was going to be it for me.
Looking at the data today, that was a pretty good bet since there have only been a few times when the average return for five years has been greater than 20 percent. There was a short period in 1937, during the mid-1950s and right before the crash of ’87.
Much to my surprise, the return for the S&P 500 for the five years that ended in February, 2014 is 23.0 percent, in the top half percent of five year returns. Yes, the bull market that was born on March 9, 2009 after a grueling 53.94 percent peak-to-trough decline that started on October 9, 2007.
Although the crash is referred to as the 2008 Financial Crisis, it started in late 2007 and ended in early 2009.
If you had the bad fortune to invest everything in stocks at the high in 2007, you would have endured a horrible loss of value, but five years after the crash, you would have made back all of your losses and even earned a positive return of 37 percent or so, which works out to about to a five percent per year return from the top of the market in 2007 to today.
That happens to exactly match what you would have earned in bonds, based on the return of the Barclays Aggregate Bond Market index (which, incidentally, was the Lehman Aggregate back in 2007), albeit with a lot less volatility.
When it first dawned on me that the returns that we’ve had in the past five years resembled what we earned during a bubble got me a little spooked. Looking at it visually (and throwing in what happened next) is even spookier.
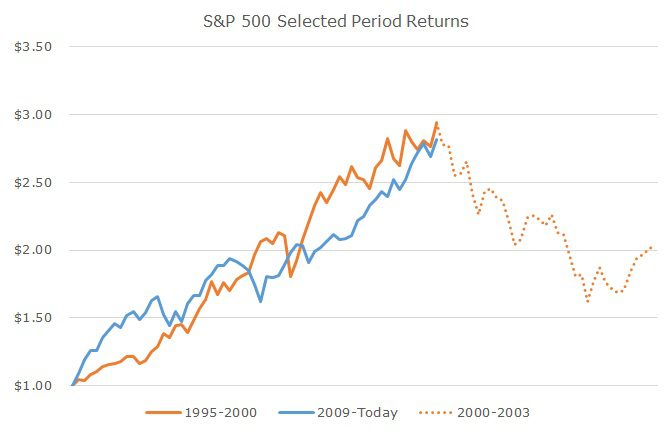
Over the years, I’ve seen a lot of chart overlays like this that compare different periods and different markets that imply impending doom and I’ve found that they don’t add up to much. While the returns are similar over these two periods, very different things were happening.
In the mid-1990s, the stocks had a relatively normal valuation. I’ll use the Shiller PE ratio here which puts the price over 10-year average earnings. In 1995, when the last 20 percent per year gains started, the Shiller PE Ratio was 25, which is over the long-term average Shiller PE ratio of 17.5.
During the bubble, the Shiller PE Ratio rose to 45 – an expansion of 80 percent that took the Shiller PE Ratio to 2.5 times the long term average. Earnings rose, but not nearly as fast as prices.
At the birth of the current bull market, the Shiller PE ratio was 13.4, almost 25 percent below the long-term average.
Today, the Shiller PE is around 25, which is about 40 percent above the long-term average Shiller PE of 17.5. Does that mean we’re in for a 40 percent crash? I don’t think so.
For one thing, the average is just that, an average. A few weeks ago, I wrote that the Shiller PE showed that the market was overvalued, but I said that prices float pretty far from the average most of the time. At the time, I said I would put a range around the average to put it in a little more perspective, so I’ve done below.
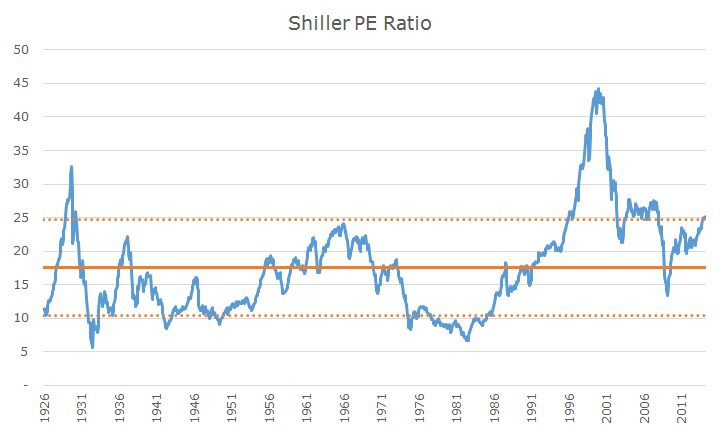
In this chart, we see the Shiller PE ratio from 1926 through today in blue, the long-term average in a solid orange line and a reasonable range around the average (one standard deviation) in the dotted orange lines.
What you can see from looking at this chart is that current valuation is right around the top of the range that I created. While I don’t think we’re staring at a 40 percent drop, I do think that valuation matters.
Studies that others have done and that we’ve replicated show that the Shiller PE explains about 40 percent of the returns over the next decade. I’ve pointed out that this means that 60 percent is still unexplained, so in engineering terms, the noise is still louder than the signal.
In other words, it’s not enough signal to trade on, but I do think it means that investors should lower their expectations about returns over the next decade. After all, the valuation could move slowly back to average over ten years, happen overnight, or not at all.
There is a lot of math and science in investing, but there’s a lot that still can’t be explained. Five years ago, no one, including me, actually wanted to buy a lot of stocks, it was hard enough just hanging on. Now that prices are higher, stocks are easier to own emotionally, but I think it’s fair to say that the expected return is lower.
That said, the expected return is still higher than bonds and since those are our two basic choices, the basic equation is unchanged. Each investor has to determine how much risk they need or can afford to take to meet their long term goals, which I believe is no easy task.