The talking heads on CNBC have been talking a lot about how the first few days of trading this January are a lot like the first few days of last year: the polar vortex, nervousness about the economy and sharply falling stock prices.
In fact, that’s all true, but I’m hard pressed to draw any implication from the similarities. First of all, we’re talking about five data points – almost nothing in a 260-day trading year – and our time horizon is a lot longer than one year!
Last year, January did post a loss of -3.46 percent, one of four losing months in 2014. It occurred to me that the old market saying, ‘as January goes, so goes the year,’ failed miserably last year.
So, I decided to pull the data and see whether the old saying has anything to it. In short, it doesn’t.
The chart below is a scatterplot that shows the monthly total return for large cap stocks in January on the x-axis and the total return for the same calendar year on the y-axis.
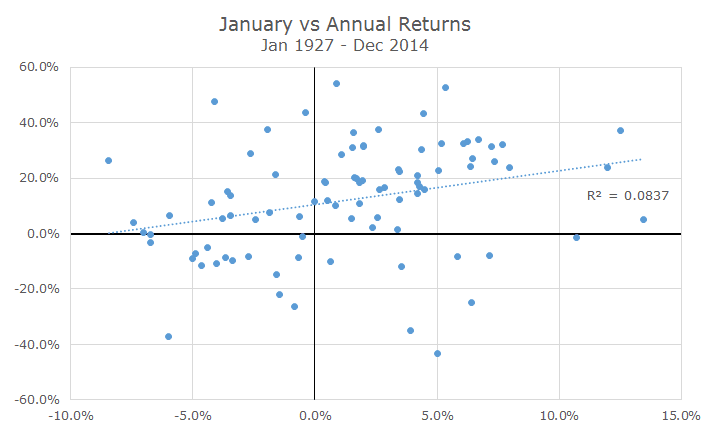
If the return in January was some kind of signal for the rest of the year, you would see a cluster of dots in the bottom left quadrant representing the down years and a cluster of dots in the top right quadrant showing that a good start in January resulted in good returns for the year.
You would expect that there wouldn’t be very many results in the top left or bottom right quadrant.
While I didn’t do an exact count, I would make an eyeball estimate that there are as many dots in the top left quadrant as there are in the bottom left quadrant, signaling that there are plenty of good years that start off poorly.
It is true that there are fewer dots in the bottom right, which represents years that started off positively and ended up poorly, but not enough to draw any strong inferences.
If I hadn’t drawn that trend line in the chart, I think the whole thing would look like a shotgun blast that doesn’t signify anything.
The trend line does imply some kind of relationship, but the number labeled ‘R2’ signals that the relationship is very weak – the returns in January only explain eight percent of the returns for the year, leaving the other 92 percent explained by other factors.
As you might expect, the returns in a single month, wherever it may fall on the calendar, doesn’t explain much about the other 11 months. Like a lot of the old, pithy expressions, this one is fun but doesn’t mean anything.
