In the past two weeks, I’ve written primers on two of the strategies that we use, over-weighting to small cap stocks and investing in cheap, value stocks.
One of the Portfolio Managers here at Acropolis correctly reminded me that all of the best strategy in the world can be undone with poor investor behavior, so I thought I would try and put some numbers on that idea.
To demonstrate how investor behavior can affect returns, I decided to look at long-term return numbers from Morningstar. In addition to publishing total return data, Morningstar also creates and publishes what they call ‘investor returns’ that are designed to estimate how the average investor fares in a particular fund.
For example, let’s say that there is a mutual fund that earns 50 percent in a year and then loses 33.33 percent in the next year. The total return for the fund is zero: everything that was earned in the first year was lost in the second year.
Now, even though the total return for the fund was zero over two years, the investors in the fund may have had quite a different experience depending on when they actually owned the fund.
It’s easy to imagine a lot of new money flowing into the fund after a 50 percent total return, but the people who bought at the end of the first year actually lost a lot of money because they only owned the fund in the second year. Therefore, the investor return is a lot different than the total return, because the actual investors fared poorly while the fund broke even.
If you’re interested, click here for a more detailed explanation of the methodology that Morningstar uses to calculate total returns and investor returns. The Cliff’s Notes version though, is that the total return is what the fund earned and the investor return depicts the average investor experience in the fund.
Let’s look at a real world example by comparing two Vanguard index funds: a small cap value fund and a small cap growth fund. The historical record shows that small cap value outperforms small cap growth based on the value premium theory that we discussed yesterday.
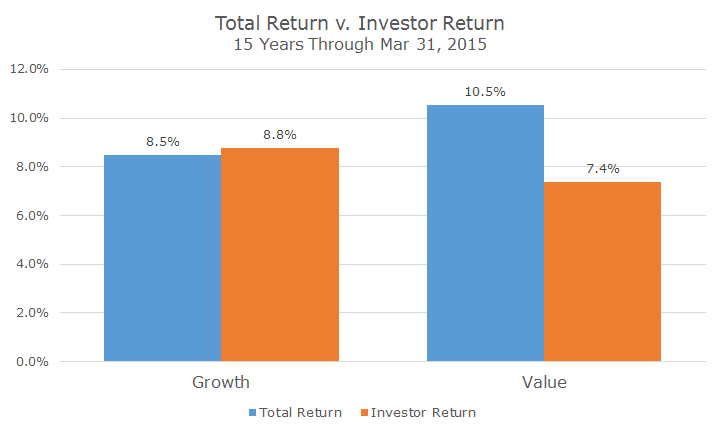
Over the 15 years that ended on March 31st, the total return for the small cap value index fund handily beat the small cap growth index fund, 10.5 percent versus 8.5 percent per annum, just as theory would predict. Of course, different time periods, especially shorter ones, will show different results, but the current 15 year record fits theory and the historical record nicely.
The average investor experience in each of the two funds was much different, however, as the chart below shows. The average investor in the small cap growth fund actually fared better than total return because the timing of contributions and withdrawals happened to be good. That’s actually a somewhat rare occurrence, but it does happen from time to time.
The value investor’s experience was much worse, even though the total return for the value index fund was much higher than the growth fund. Investors in the value fund added and subtracted money at bad times, so much that they only earned 7.4 percent. This kind of difference between the total return and investor return is much more common and is usually explained by bad behavior like performance chasing.
The point here, though, is that even a superior strategy doesn’t work well if you’re not disciplined and a less accepted strategy can work just fine if you stick with it. Of course, the best combination is sticking with a good strategy, but we all know that it’s a lot easier said than done.


