We all know that the first quarter was a wild ride as the S&P 500 fell -10.29 percent through February 11th and then rocketed back over the rest of the quarter and finished in the black.
When I tallied up the results for the first quarter, I have to admit that I was surprised by the range of returns within the major asset classes, from the -5.4 percent decline in US microcap stocks to the 6.3 percent gain in US REITs.
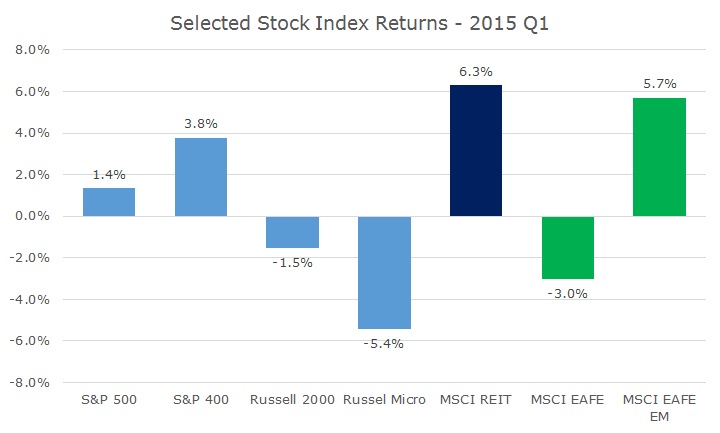
Even among non-US stocks, there was a fairly wide range as developed markets fell -3.0 percent and emerging markets notched up gains of 5.7 percent.
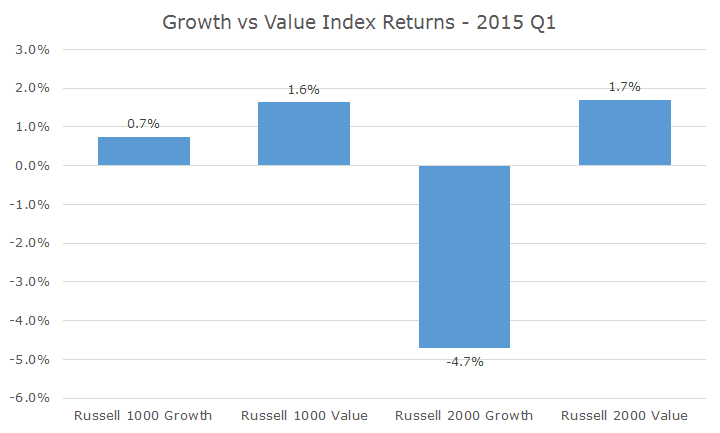
If we break down US stocks into growth and value stocks, we see that value out-performed growth stocks fairly dramatically, especially in small cap stocks.
While value stocks fared better than growth in large cap by 0.9 percent, the difference in small cap was much more dramatic – there is a 6.4 percent spread between small cap growth and value stocks.
The range of returns wasn’t as large among bond market indexes, but was still fairly dramatic for the bond market. I’ve color coded the returns by their relationship to the Barclays Aggregate: green indicates that they aren’t included in the Agg and the light blue indicates that they are components of the Agg.
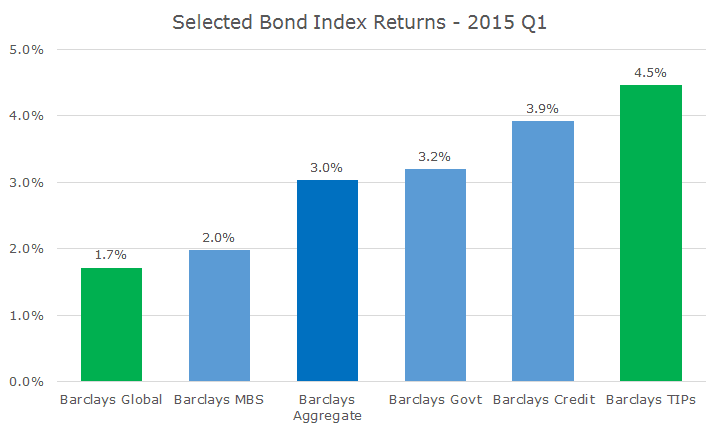
Corporate bonds (credit) trailed the overall market during first part of the quarter while stocks were falling (further evidence that the two are somewhat correlated) and turned around dramatically as the stock market turned around.