Stocks were almost back to even for the year when investors pulled back yesterday beginning after the lunch hour. There was no obvious single driver sending prices lower, although it appears to have started in consumer discretionary stocks, where losses were the heaviest, down -1.94 percent on news from the retail sector about a slow Christmas.
The nervousness among stock investors has sent bond prices higher with the yield on the 10-year US Treasury note closing at 2.83 percent, a fall from Friday’s close of 2.88 percent.
The Barclays Aggregate bond index is up 0.72 percent in the first 13 days of this year, chewing through more than a third of last years bear market decline. Of course, it’s a long time before the end of this year, so it’s just watching volatility at this point.
When I first started in the financial services industry, I often looked at the yield curve and wondered where the optimal point for investment was on ‘the curve.’ I had the false idea that once I could find the optimal location, investing in bonds would be easy.
Like most things, I was disappointed to learn there is no single optimal location on the curve. Not just because different investors have different needs that require different strategies, but also because ‘the’ curve is kinetic – what was optimal a month ago may not be the best position today.
Even though the yield curve is dynamic, there are four basic shapes: normal, inverted, flat and steep.
When long-term interest rates are higher than short-term interest rates, the curve is thought to be normal – the additional yield is compensation for the additional uncertainty of a longer time horizon.
If short-term interest rates are higher than long-term rates, the curve is said to be inverted and generally occurs before a recession when investors are predicting an economic slowdown.
A flat curve is when the yields are the same for three months and 30 years. I remember this happening in the late 1990s when the 30-year bond only yielded 10 basis points (one tenth of a percent) more than three-month Treasury bills.
A steep curve is just the opposite of a flat curve – the curve is normal in the sense that long-term rates are higher than short-term, but the magnitude of the difference is much greater than normal.
Today, the yield curve is steep. One way to see the steepness is to look at the difference in yield between the two-year US Treasury note and the 10-year US Treasury note.
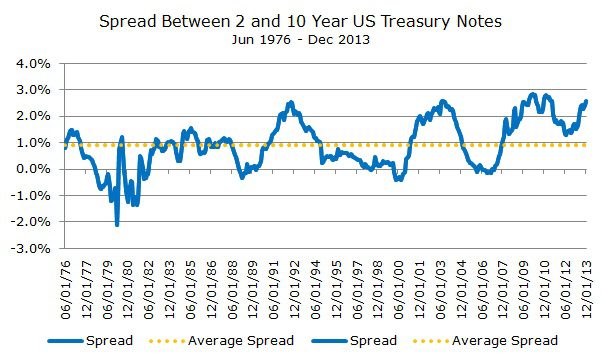
On the chart above, the blue line shows the difference between these two bonds, which is known as the ‘spread.’ (Actually, there are many spreads that bond investors watch and they always represent the difference between two different rates).
The yellow dotted line shows the average spread over the last 40 years, the inception of the two-year data from the Federal Reserve.
When the blue line is above the yellow dotted line, you could say that the curve is steep and when the blue line is below zero, the curve is inverted.
One of the bedrock strategies that we employ is to respond to the changes in the yield curve. When the curve is inverted, for example, we would shift maturities to short-term bonds where returns are likely to be the highest.
When the curve is normal – and especially when it’s steep, it makes sense to extend the term of the portfolio within reason to capture the higher expected return associated with a steep curve.
You could call this a ‘carry’ strategy, which simply means investing in the securities with the highest expected cash flows. This isn’t particularly descriptive though, because you could call dividend stocks a carry strategy, but no one does. Even though the concept applies to stocks and bonds, usually carry refers to currency trading. I wrote a detailed piece on currency carry trading for Seeking Alpha that you can read here.
The funds that we use refer to the strategy as ‘variable maturity,’ which makes more sense – the maturity varies depending on the shape of the yield curve. At the end of 2012, I wrote a fairly detailed piece about variable maturity strategies that you can read by clicking here.
Regardless of the shape of the curve, we will continue to adjust our strategies to find the optimal place for investment of the short and long run.