As I described yesterday, the S&P 500 is on a hot streak this year, up 9.68 percent so far this year through yesterday.
I should also note that outside of REITs (which I mentioned a few days ago) and Emerging Markets, the S&P 500 is the hottest thing going this year. Given that REITs and Emerging Markets are relatively small portfolio weights, you might not be feeling the benefit from those asset classes as much as you might be feeling the pain of the asset classes that aren’t performing as well.
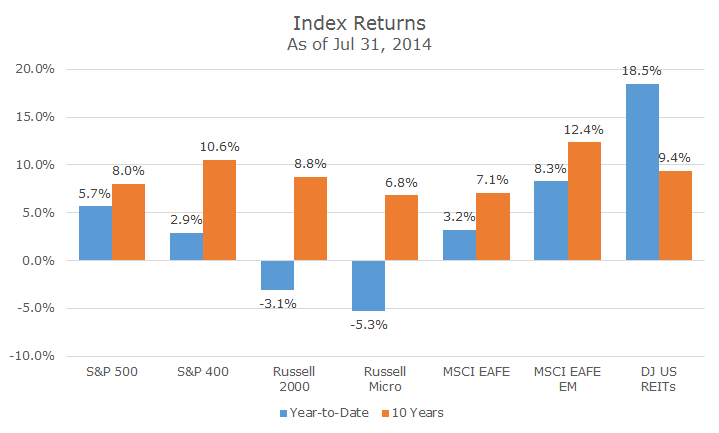
The following chart shows the index performance for the stock asset classes that we use for this year so far and for the 10 years, both ending on July 31. Returns were great in August, so this understates everything by a little bit, but I wanted the end dates to match and getting 10 year returns for an odd date is trickier than you might think.
Although there are variations across clients, a ‘typical’ Acropolis stock portfolio has about 40 percent of the assets in large cap US stocks. REITs and Emerging Markets, the outperformers, add up to around 10 percent of the portfolio. The remaining five asset classes that are underperforming the S&P 500 make up the remaining 50 percent of the stock allocation.
If you can’t do the math in your head, all this means that, forgetting any over/underperformance by asset class, a diversified portfolio of stocks is underperforming the S&P 500.
A few clients have asked me why we should invest in these asset classes given that they are underperforming.
Of course, my first answer is that if we could time it, we would. Unfortunately, we can’t even say whether the S&P 500 is going to be up or down next year and the odds of guessing correctly are 50/50. The odds of saying that small cap will outperform large cap or that international will underperform emerging is outlandishly small.
I realize that this is an unsatisfying answer, so in the chart above, I thought it would be interesting to show the longer term (10-year) numbers. When looking at the last decade, the picture is a little different – all but two of the asset classes outperform the S&P 500.
Using the same asset allocation, those two asset classes represent 25 percent of the portfolio, which means that 35 percent outperformed (the remaining 40 percent is the S&P 500, so there was no over or under performance.
If we create a model portfolio using this asset allocation and assume monthly rebalancing, no transaction costs, no taxes and no over/under performance within the asset class (yep, a bunch of unrealistic assumptions), the model portfolio outperformed the S&P 500 by about two percent per year over the last ten years, even though it’s underperforming so far this year.
Even the 10-year period isn’t really long enough to make any real decisions – why would you invest in micro cap given what happened since 2004? Over the long run, we do expect small stocks (in the form of mid, small and micro cap) to outperform large cap.
We expect international stocks to match US stocks, but the timing will be different, so the combination should produce lower volatility than either one over time. The story is different in emerging markets where the political risks imply higher returns (not the growth).
I’ve said before, diversification doesn’t work all of the time, but it should work over time.