For the 30th time this year, the S&P 500 closed at an all-time high. Yesterday was an even bigger deal because it crossed a big round number: 2,000. While that shouldn’t mean anything special, it does.
Investors are humans that are subject to all kinds of psychological biases and round number attachment (my name) seems to be one of them. If you go to Wikipedia, you can get a list of all of the dates that the Dow Jones Industrial Average crossed major milestones (first by fives, then 10s, then 100s, and now 1,000s).
While a lot of people looking at the close yesterday will be excited, a larger number, in my opinion, will feel anxiety about being in a bubble or on the precipice of a crash.
Of course, we may be in a bubble or on the precipice of a crash – I have no idea – but, I think it may be useful to realize that focusing on just one metric, price, is not sufficient. The chart below shows the operating earnings for the S&P 500 since 1988 (as far back as the Standard & Poor’s website provides).
Over the past 25 years, earnings have grown substantially from $5.48 per share to $29.45 per share most recently (with 98 percent of companies reporting).
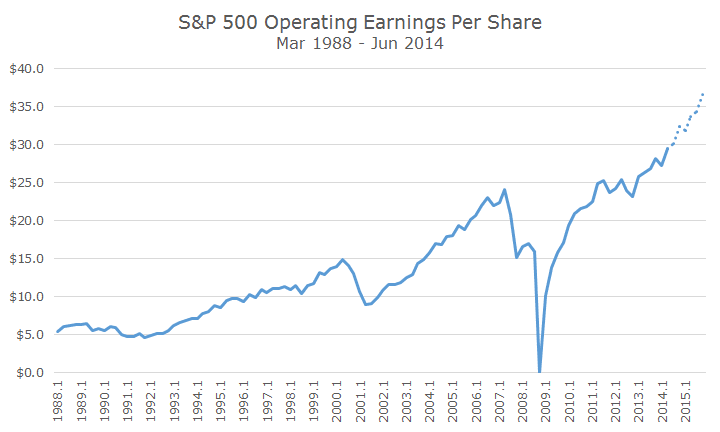
Like a stock market chart, there is a massive drop during the 2008 crisis, although this one is much worse since operating earnings went slightly negative in 2009 (operating earnings exclude ‘one-time’ events – and there were a lot of those during the crisis).
Former Federal Reserve Chairman Ben Bernanke actually said in a statement that was released yesterday that the 2008 crisis was the worst in global history, ‘including the Great Depression.’ His academic background is the Great Depression, so that’s quite a statement. Obviously, he was talking about the crisis and not the overall economy.
Still, three years later, operating earnings were all the way back and projections for the next two years (in the dotted line) suggest more heady days to come. Of course, you know how I feel about forecasts and don’t put much stock in this, but it’s still important to include because it reflects current expectations for future near term profits.
Long-time readers will also recognize that I don’t think that the price or the earnings alone are useful. I prefer a slightly more complex measure called the Shiller PE that looks at the current price over the average earnings over the past decade.
I’ve written about the Shiller PE before (click here for a refresher) and this measure basically shows that the market is overvalued.
Before you panic, it’s important to remember that the market can remain overvalued by this metric for years at a time, even decades. This is not a short term signal. And, it’s not even a great long-term signal: the signal to noise ratio is around 0.40 meaning that there is more noise than signal.
Furthermore, the process of getting back to a normal valuation doesn’t have to come in the form of a crash – it can happen through lower than average returns in the coming years. Personally, I think that’s likely.
If you’re still working, it’s important to continue to add to your investment portfolio. If you’re retired, make sure that you’re comfortable with your asset allocation and that you have enough in cash and bonds to weather any storms that may be on the horizon.
In the meantime, it’s pleasant to enjoy the positive momentum for as long as it lasts.

David is a trusted advisor to 50 families, delivering comprehensive financial solutions, including financial planning, investment management, cash management, tax planning, estate planning, and charitable giving. As Chief Investment Officer, he leads the Investment Committee and the research and trading team. His team continuously evaluates investment strategies and securities, working closely with Portfolio Managers to implement them effectively.