I read an interesting thought experiment the other day. The question posed was simple enough: if you knew how much a stock was going to rise in a given year, how much would you bet on it?
Taking it another step, if you knew that the stock was going double in a year, would you borrow money and leverage your return? If so, and forgetting margin requirements, how much would you borrow?
When I first considered an answer, I decided that 100:1 would probably be a good bet. I figured that the question had a trick in it, so I didn’t want to go too far, but I also wanted a big time return.
As I read on, I realized that I had made a big mistake by going too big because I forgot an incredibly important element: just knowing the beginning-to-end total return misses the path in between point A and point B.
To illustrate the point, I decided to look at one of the hottest stocks of 2017: Nvidia, a technology company that designs graphic chips that are used in high-end computers, game consoles and other applications like self-driving cars. Last year, their stock gained 81.8 percent.
I built a simple model that shows what the returns would have been in 2017 with varying amounts of leverage. The chart below shows the results. The dark blue line, labeled 1:1 shows the unleveraged return and you can see a $10,000 investment grow to nearly $20,000.
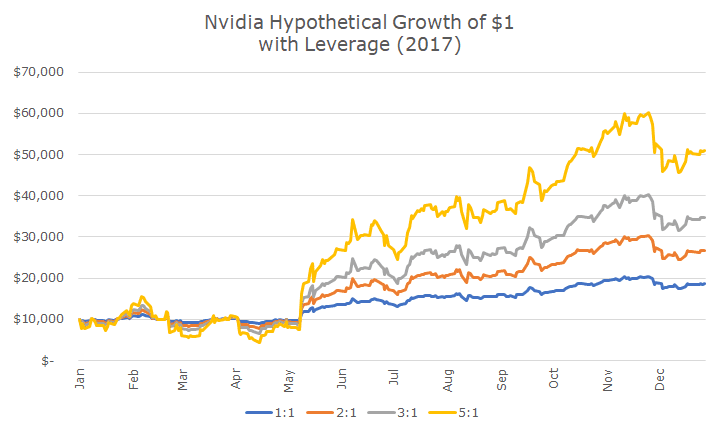
The orange line, labeled 2:1 depicts the results if you had borrowed two dollars for every dollar of your own and the results get even better. The gray line that shows 3:1 gets better still, so I jumped up the leverage to 5:1 and the $10,000 grows more than five-fold.
Of course, I got greedy with my little model and jumped the leverage from 5:1 to 10:1 and here’s what happened:
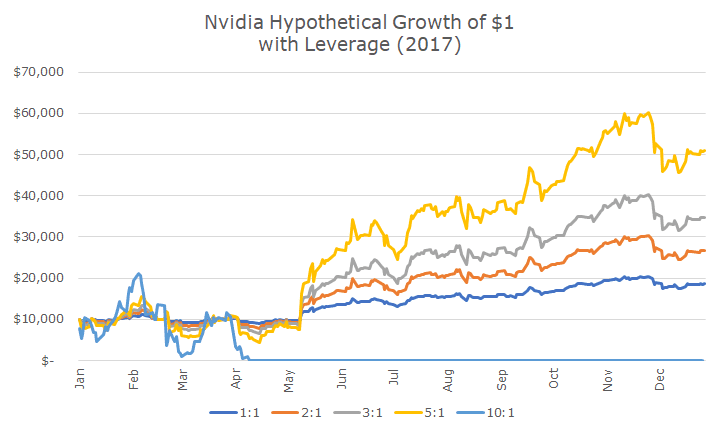
The light blue line shows that the $10,000 investment didn’t get through the end of April because it was totally wiped out. At 10:1 leverage, an investment is wiped out on a 10 percent drawdown.
In this example, the $100,000 investment has $10,000 and $90,000 of margin. When the stock declined 10 percent, all of the equity is wiped out. The following chart shows the drawdowns for the various degrees of leverage.
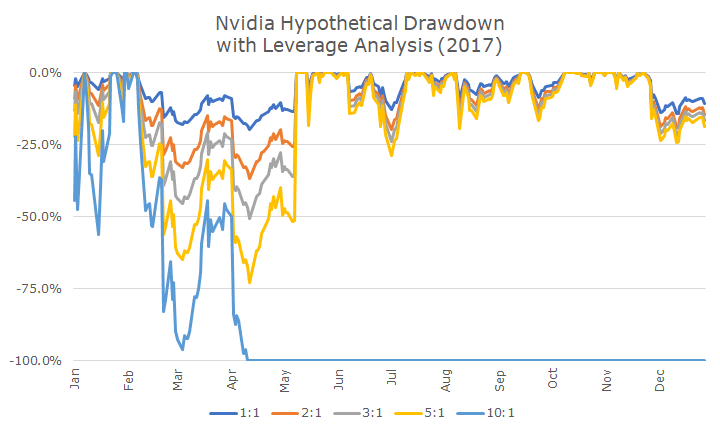
I think this chart is interesting for a few reasons beyond seeing how the 10:1 investment completely blows up. First, notice how the 10:1 investment is down almost 50 percent on day one. Who could live with that?
Second, notice how the 5:1 leverage that we saw grow from $10,000 to $50,000 in the previous chart suffers a 75 percent in April. Who can live with that? Throughout the year, in July and December, the drawdowns are 20 percent, which would be still be a tough ride.
If someone had given me a magical newspaper that showed an 80 percent return one year in the future, I’d have serious doubts about the magic in the paper and/or my mental stability.
As you might imagine, we really don’t use leverage, but it does show up in client portfolios in two ways. First, clients sometimes have a gap between the purchase of a new house and the sale of an old house.
If that gap is short enough, it can make more sense to borrow money short-term instead of selling the portfolio and realizing capital gains only to buy back the same portfolio a few years later. Of course, we describe the risks to those clients on these individual circumstances – and it’s nowhere near 10:1!
The second way that leverage shows up is in some of the mutual funds and exchange-traded funds (ETFs). All funds maintain some cash to deal with the money flowing in and out of the fund.
The fund companies, including conservative firms like Vanguard, sometimes buy a futures contract equal to the amount of cash on hand. Futures have embedded leverage, but the fund companies aren’t using the leverage to increase returns, but to eliminate the cash drag.
These applications are limited and are nothing like the speculative investing that I described above.
So the next time you find a magical newspaper that tells you stock prices in the future, don’t get greedy!

David is a trusted advisor to 50 families, delivering comprehensive financial solutions, including financial planning, investment management, cash management, tax planning, estate planning, and charitable giving. As Chief Investment Officer, he leads the Investment Committee and the research and trading team. His team continuously evaluates investment strategies and securities, working closely with Portfolio Managers to implement them effectively.